Free Arbitrage Software: What You Really Get for Free, and How to Turn Scanner Data into a Trading Plan Tuesday October 13th, 2026 – Posted in: Arbitrage Software, Forex trading
BJF TRADING GROUP · FREE TOOLS · OPEN RESEARCH
Free Arbitrage Software: What You Really Get for Free, and How to Use It
Search for “free arbitrage software” and you get three things: correlation indicators renamed as arbitrage tools, triangular-arbitrage demos on GitHub, and trial versions that stop working after a week. None of them answers the question that matters: is there an arbitrage opportunity on my broker, on my symbol, at the hours I trade? This guide shows what BJF gives away for free, what 30 days of real scanner data look like, and a five-step workflow that turns that data into a trading plan before you spend a dollar on execution software.
In this article
- What “free arbitrage software” usually means
- The free BJF toolkit: scanner, Android app, crypto scanner, audit kit
- The three free apps in one minute each
- What 30 days of scanner data show
- From scanner to trading plan: a five-step workflow
- Worked example: gold on Broker A vs Broker B
- Where free ends and execution begins
- FAQ
What “free arbitrage software” usually means
Most free downloads that call themselves arbitrage software fall into one of three groups. Knowing which one you are looking at saves hours.
| Type | What it really does | Can it find latency arbitrage? |
|---|---|---|
| “Arbitrage indicator” for a trading terminal | Compares two correlated pairs (for example EUR/USD and GBP/USD) and highlights when their correlation breaks. That is statistical arbitrage, a useful strategy on its own. | No. It never compares your broker to a faster price source. |
| Triangular-arbitrage scripts on GitHub | Walk a graph of exchange rates (A→B→C→A) looking for a loop that returns more than it started with. Fine for learning; in practice the loop closes before a retail order fills. | No. Different question entirely. |
| Trial version of a paid bot | Full execution software with a 7- or 14-day limit. Useful if you already know what to test; useless if you have no idea which broker, symbol and hours to point it at. | Yes, but the clock is ticking before you have done your homework. |
| Measurement tools (this article) | Compare a fast reference feed with real broker quotes and record every window where the broker lagged: size in pips, duration in milliseconds, time of day. | Yes. This is the data a latency-arbitrage bot runs on, published for free. |
BJF has sold execution software since 2000 and knows that the expensive mistake is not the license; it is running a bot on the wrong broker at the wrong hours. So the part we give away is the measurement layer. The execution layer stays commercial.
The free BJF toolkit
Everything below is free, needs no signup and no email, and does not touch your trading account.
| Tool | What it gives you | Best for |
|---|---|---|
| Free Forex Arbitrage Scanner (browser) | Live dashboard of every detected lag window between a fast feed and five anonymized retail brokers on EUR/USD, GBP/USD, USD/JPY, USD/CAD, AUD/USD and XAU/USD. KPIs, hour-by-weekday heatmap, histograms, session breakdown, broker lag profile, events table with CSV export, 365 days of history. | Choosing a symbol, a broker type and trading hours before you automate anything. |
| Forex Arbitrage Scanner for Android | The same statistics on your phone: broker-lag KPIs, best trading hours, session heatmap and the full event feed. 14 languages, no personal data collected. | Checking the market from anywhere; watching whether a volatile day is producing windows. |
| Free Crypto Arbitrage Scanner + Crypto Arbitrage Monitor for Android | Cross-exchange price differences for the same coin, estimated profit per gap and opportunity history, with the same measurement-only philosophy. Desktop version and Android app. | Crypto traders comparing exchanges before funding accounts. |
| Funding Rate Scanner for Android | Live funding rates of USDT/USDC perpetuals on nine exchanges (Binance, Bybit, OKX, Bitget, Gate, MEXC, KuCoin, BingX, Hyperliquid), the biggest funding spread per coin, the long/short delta-neutral setup, estimated APR, fees and break-even time. | Finding and sizing funding rate arbitrage positions. |
| BEQI broker execution audit toolkit (open source) | The methodology and code behind the scanner’s detection logic, so you can run your own measurement against your own broker and build a named leaderboard if you want one. | Developers and anyone who wants to verify the numbers instead of trusting them. |
| Funding rate arbitrage calculator | Works out the net yield of a spot-vs-perpetual position after fees, so you know whether a funding rate is worth the capital. | Crypto carry trades. |
| Arbitrage trading education program | Free course material on latency, lock, hedge and statistical arbitrage. | Understanding what the scanner numbers mean before acting on them. |
The three free apps in one minute each
All three Android apps read the same public data as the web tools and collect no personal data. Each short video shows what the app displays and how to read it.
Forex Arbitrage Scanner
Broker price delays against a fast feed: gap size, window duration, best hours, 24 h to 90 days of history.
Crypto Arbitrage Monitor
Price gaps for the same coin between exchanges, estimated profit per gap and opportunity history.
Funding Rate Scanner
Funding spreads across nine exchanges, the long/short delta-neutral setup, APR, fees and break-even time.
The rest of this article is about the first tool, because it is the one that produces data you can act on.
What 30 days of scanner data show
All figures below are real detected events from the public dashboard for September 11 to October 11, 2026, all five monitored brokers, no filters. You can reproduce every number by opening the scanner and setting the same date range. Differentials are in pips as the dashboard displays them.
Finding 1: one symbol produced 97% of the events
| Symbol | Opportunities | Avg differential, pips | Avg duration, ms | Best 30-min window, UTC |
|---|---|---|---|---|
| XAU/USD | 144,447 | 29.3 | 129 | 13:30–14:00 |
| GBP/USD | 1,654 | 19.8 | 133 | 21:20–21:50 |
| EUR/USD | 1,612 | 18.0 | 146 | 12:30–13:00 |
| USD/JPY | 1,000 | 19.7 | 112 | 21:30–22:00 |
| USD/CAD | 583 | 20.9 | 146 | 12:30–13:00 |
| AUD/USD | 13 | 16.0 | 68 | 21:40–22:10 |
Gold is where retail brokers lag. The majors do produce windows, but on the order of 50 per day across five brokers, not 5,000. If you are deciding which instrument to study first, the scanner has already answered: start with XAU/USD, and treat EUR/USD and GBP/USD as a second project with tighter thresholds.
Finding 2: three days made the month
The daily series is far from flat. Most days in September showed between 10 and 160 events. Then October 6 produced 19,670, October 8 produced 38,907 and October 9 produced 88,718. Those three sessions account for roughly 98% of the month’s opportunities, and nearly all of them were gold, on days when XAU/USD moved hard.
This is the single most useful thing the free scanner teaches: latency arbitrage is not a steady drip of small edges. It is long stretches of nothing punctuated by days when the broker’s pricing engine cannot keep up. A bot that is not ready on those days, or a trader who concluded from a quiet week that “there is no arbitrage here”, misses the whole year’s edge. The Android app exists for exactly this reason: a glance at the event feed tells you whether today is one of those days.
Finding 3: the hours are predictable
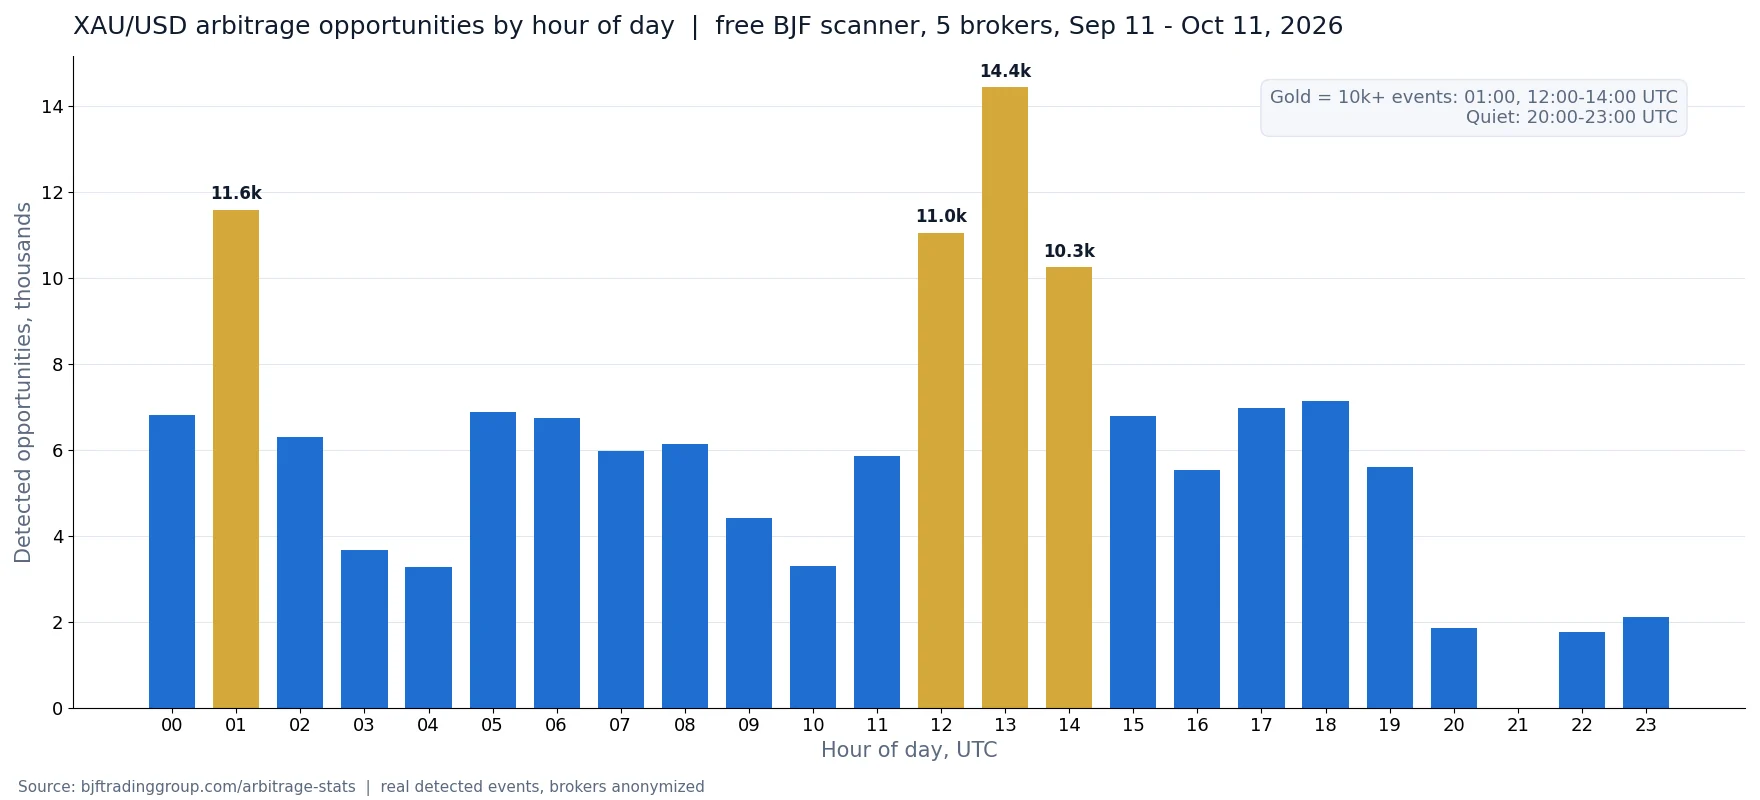
Gold events cluster at 12:00–14:00 UTC (London afternoon, US pre-market and the 13:30 US data releases) with 35,739 events in those three hours, and at 01:00 UTC (Asian open, 11,590 events). The hours 20:00–23:00 UTC are nearly empty. For the majors the picture shifts: GBP/USD and USD/JPY peak around 21:30 UTC, EUR/USD and USD/CAD around 12:30. Session totals for gold: Asian 49,155, London 25,668, London/New York overlap 48,074, New York 21,550.
Finding 4: the brokers are not the same
| Broker (anonymized) | Opportunities | Avg differential, pips | Avg duration, ms | Best window, UTC |
|---|---|---|---|---|
| Broker A | 60,897 | 29.0 | 82 | 01:00–01:30 |
| Broker B | 26,350 | 29.2 | 241 | 13:20–13:50 |
| Broker C | 19,845 | 28.6 | 95 | 13:30–14:00 |
| Broker E | 21,964 | 29.3 | 171 | 13:30–14:00 |
| Broker F | 20,253 | 28.3 | 117 | 12:30–14:30 |
Broker A produces the most windows but closes them fastest: 82 ms on average. Broker B produces fewer than half as many, but each one stays open three times longer. Which of the two is “better” depends entirely on your own round-trip latency, and that is the subject of the worked example below.
Finding 5: most windows are shorter than a retail round trip
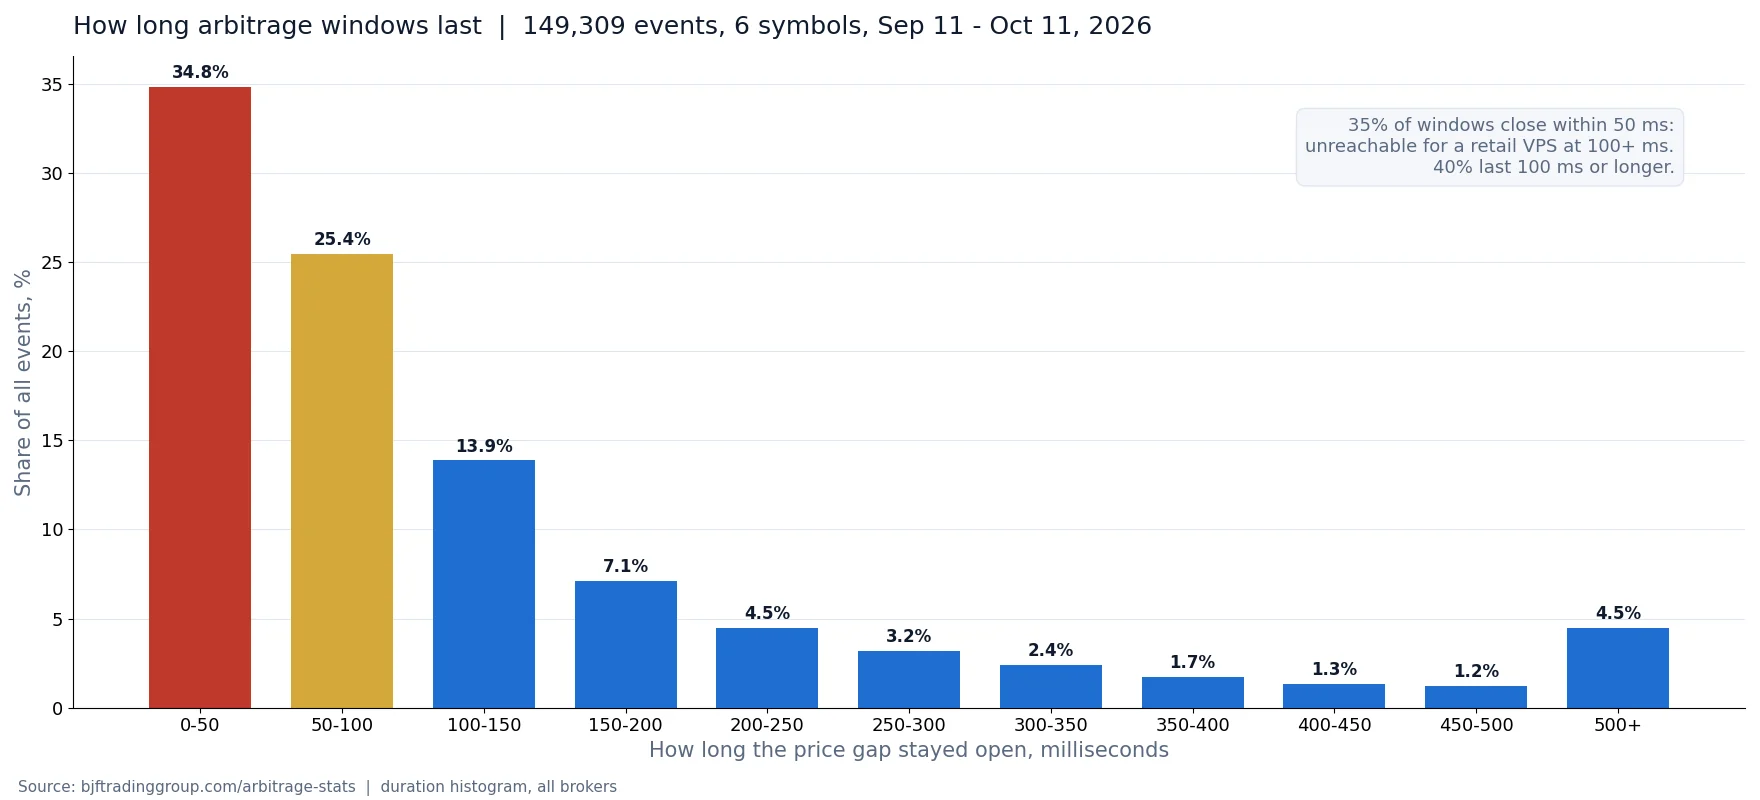
Of 149,309 windows, 51,970 (35%) closed within 50 ms and another 37,991 (25%) within 50–100 ms. About 40% lasted 100 ms or longer, and 19% lasted 200 ms or longer. A typical retail VPS has an 80–180 ms round trip to the broker, so more than half of what the scanner detects is physically out of reach for most readers. The remaining 40% is the real market.
From scanner to trading plan: a five-step workflow
The scanner does not trade. Its value is that it lets you make five decisions with data instead of forum opinions.
- Pick the symbol. Open the scanner, set one month, look at the symbol ranking. In the current dataset the answer is gold first; the majors are a second project.
- Pick the broker profile. Filter by each broker in turn and compare count against average duration. Short-and-many (Broker A) suits co-located setups; fewer-but-longer (Broker B) suits a standard VPS.
- Pick the hours. Read the heatmap and the best-window KPI. Restrict your strategy’s trading hours to the dense blocks (for gold: 12:00–14:00 and around 01:00 UTC) and switch it off in the empty ones.
- Set thresholds from the histograms. The differential histogram shows where the mass of opportunities sits; put Diff to open just above the noise floor, not at the peak. The duration histogram tells you the minimum window your latency can reach; set the minimum duration filter above your measured round trip.
- Export the CSV and sanity-check your backtest. If your backtester reports thousands of EUR/USD events per week and the public dataset shows about 50 per day across five brokers, the backtester is fooling you. Compare event counts per symbol and per hour before trusting any equity curve.
Only after step 5 does it make sense to pay for execution software, because only now do you know what to configure it for.
Worked example: gold on Broker A vs Broker B
Suppose your VPS measures a 120 ms round trip to your broker. With SharpTrader’s execution-time model, the order fills at the price the market had roughly 60 ms after the signal (one-way leg), so a window has to stay open at least that long to be reachable at all, and comfortably longer to leave profit after the fill.
- Broker A: 60,897 windows, average 82 ms. Around a third of them close before your order can arrive. The 100 ms+ tail is still large in absolute terms (tens of thousands of events over the month), but your fill rate will be low and every miss costs spread. This broker rewards a co-located bridge at 30–60 ms, not a standard VPS.
- Broker B: 26,350 windows, average 241 ms. The typical window is four times your one-way latency. Fewer signals, but most of them are reachable from an ordinary VPS, and the differential (29.2 pips) is the same.
With a 120 ms round trip, Broker B is the better target despite showing fewer events. Change the latency to 40 ms and the answer flips. The scanner cannot know your latency, but it gives you the one number you need to combine with it: average and distribution of window duration per broker. Then run the same parameters at 50 ms and 150 ms in a backtest with realistic execution time to see which assumption your strategy survives.
Where free ends and execution begins
The honest boundary of free arbitrage software is this: measurement is free, execution is not, and the reason is cost, not marketing. Acting on a 100 ms window needs a VPS near the broker, a fast feed subscription, broker-dialect support for the way each venue handles requotes and partial fills, and risk controls that stop the bot when the broker’s anti-arbitrage plugin starts delaying fills. None of that is cheap to run, so it is sold as a license.
What the free layer saves you is the far larger cost of running execution software against the wrong broker, the wrong symbol or the wrong hours. If you work through the five steps above and the scanner shows reachable windows on a broker you can open an account with, the next step is SharpTrader Lite for the entry level or SharpTrader Pro for the full strategy set. If the scanner shows nothing reachable for your setup, you have just saved the license fee and a lot of frustration. Either way the free tool did its job.
Start with the data, not the download
Open the live scanner, set a one-month range and read the symbol ranking, the heatmap and the broker lag profile. Then install the Android app so you notice the volatile days when they happen.
Open the free scanner
Get the Android app
FAQ
Is there any arbitrage software that is completely free and actually works?
For measurement, yes: the BJF forex and crypto scanners and the open-source BEQI toolkit are free with no trial limit and no signup. For execution, no serious tool is free, because running it costs real money in infrastructure and feed subscriptions. Anything that promises a free arbitrage bot with guaranteed profit should be treated as a scam.
Does the free scanner work with my broker?
The public dashboard monitors five anonymized brokers. If yours is not among them, the data still tells you what retail lag looks like by symbol and hour, and the BEQI toolkit lets you run the same measurement against your own account.
Why are the brokers anonymized?
Two reasons: publicly ranking regulated firms invites legal exposure out of proportion to the research value, and naming them would give brokers an incentive to optimize for the audit instead of for execution quality. The methodology is open, so anyone can attribute the data themselves.
Can I download the data?
Yes. The events table exports to CSV for any date range within the last 365 days: timestamp, symbol, broker, direction, differential and duration.
What is the difference between the browser scanner and the Android app?
Same data, same detection engine. The browser version has the full filter bar and CSV export; the app is built for a quick check of KPIs, best hours and the live event feed on a phone.
How much does the paid software cost after I have done the free analysis?
SharpTrader Lite is the entry-level execution platform and SharpTrader Pro the full version; backtesting and parameter optimization on real ticks are available through the SharpTrader Optimizer. Current prices are on the product pages.
