Raw Spread vs Standard Account: The Real Cost per Trade for Algorithmic Forex Traders Monday November 16th, 2026 – Posted in: Arbitrage Software, Forex trading
Raw Spread vs Standard Account: The Real Cost per Trade for Algorithmic Forex Traders
“Zero spread plus commission” or “no commission, wider spread”: which forex account is really cheaper? The answer is a calculation, not a slogan. This guide shows how to convert any commission format into pips, how to compute the full round-turn cost per lot, where the break-even between the two account types lies, why the same commission costs a different number of pips on every currency pair, and why the account choice matters far more for scalping, latency and arbitrage strategies than for swing trading.
- Raw spread vs standard account: the short answer
- What a forex trade really costs
- How commission is quoted and how to convert it
- Worked example: cost per lot on EUR/USD
- Same commission, different cost in pips
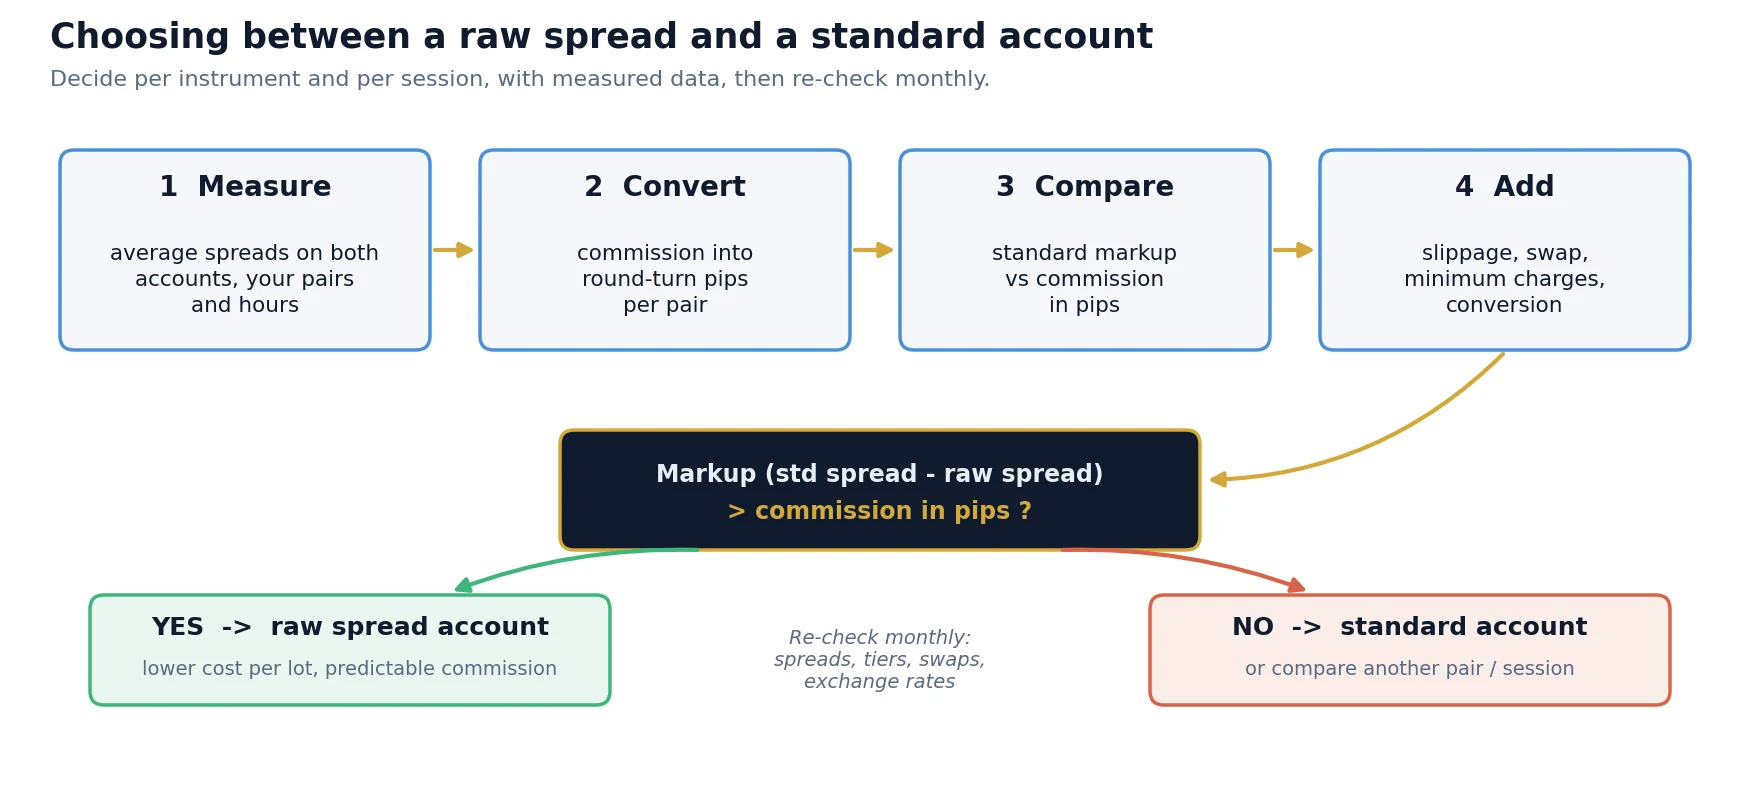
- The break-even rule: when raw beats standard
- Cost as a share of your edge, by strategy
- Quoted vs effective spread
- Hidden cost details in account conditions
- What algorithmic and arbitrage traders should choose
- Step by step: calculate your real cost per lot
- Risks and limitations
- FAQ
Raw spread vs standard account: the short answer
Short answer: a standard account charges no separate commission; the broker’s income is built into a wider spread. A raw spread (often called ECN, zero or razor) account passes through a tighter spread close to the liquidity providers’ prices and charges a fixed commission per lot instead. The raw account is cheaper whenever the standard account’s extra spread is larger than the commission expressed in pips. On major pairs that is usually the case, typically by 0.1 to 0.5 pips per round turn, but it depends on the pair, the commission format and the hours you trade. For strategies that earn only a few pips per trade, that difference is a large share of the edge; for swing trades it is almost irrelevant.
Both account types usually trade the same instruments on the same infrastructure. What changes is how the broker gets paid: through a markup hidden in every quote, or through a visible fee per lot. A visible fee looks more expensive because you see it in the trade history, while the markup in a standard account never appears as a line item. That is exactly why the comparison has to be done in one unit, pips or money per lot, rather than by comparing the headline spread of one account with the headline spread of the other.
Illustrative typical values, not the conditions of a specific broker. Use the average spreads and commission of your own broker in the calculation.
What a forex trade really costs
A round turn (open and close one position) has up to six cost components. Only the first two differ by design between account types, but all six belong in the calculation, because a cheap headline in one component can be offset by another.
| Cost component | Standard account | Raw spread account | Notes |
|---|---|---|---|
| Spread | Wider, includes the broker markup | Close to the aggregated liquidity price | Paid once per round turn (you buy at the ask and sell at the bid) |
| Commission | None | Fixed per lot or per million | Charged per side or per round turn, see next section |
| Slippage | Depends on execution | Depends on execution | Often similar, but not always; measure it (see our forex slippage guide) |
| Swap / rollover | Per night held | Per night held | Can differ between account types of the same broker |
| Currency conversion | On profit and loss in another currency | On profit and loss and on commission | Matters when the account currency is not the quote currency |
| Spread widening | At rollover and news | At rollover and news | Raw spreads widen too; the commission stays the same |
The spread is the cost that most traders underestimate, because it is never charged as a separate item. When you open a buy at the ask and close it at the bid, the position starts with a loss equal to the spread. In a standard account part of that spread is the broker’s markup; in a raw account most of it is the market’s own bid-ask spread, which you would pay with any broker that uses the same liquidity providers and aggregation.
How commission is quoted and how to convert it
The biggest source of wrong comparisons is the commission format. Brokers quote the same type of fee in at least four different ways, and some of them hide a factor of two.
| Format | Example | Round-turn cost for 1 lot EUR/USD at 1.0800 | Watch out for |
|---|---|---|---|
| Per lot, per side | 3.50 USD per lot per side | 7.00 USD | “3.50” looks like half of the real cost; it is charged on open and on close |
| Per lot, round turn | 7.00 USD per lot round turn | 7.00 USD | Often booked in full at the opening of the trade |
| Per million traded, per side | 35 USD per 1M USD traded | 7.56 USD | Calculated on notional in USD, so it grows with the exchange rate |
| Percentage of notional | 0.0035% per side | 7.56 USD | Same as per million: 0.0035% = 35 per million |
| Fixed in account currency | 3.00 EUR per lot per side | 6.00 EUR = 6.48 USD | Converted at the current rate; changes with EUR/USD |
To compare any commission with a spread, convert it into pips of the instrument you trade. Two formulas are enough:
One standard lot is 100,000 units of the base currency. For EUR/USD at 1.0800 the notional is 108,000 USD; at 35 USD per million per side that is 3.78 USD per side, 7.56 USD per round turn. The pip value of one lot of EUR/USD is 10 USD, so the commission costs 0.756 pips. The same 35-per-million rate on AUD/USD at 0.6600 costs only 4.62 USD, because the notional is only 66,000 USD.
Worked example: cost per lot on EUR/USD
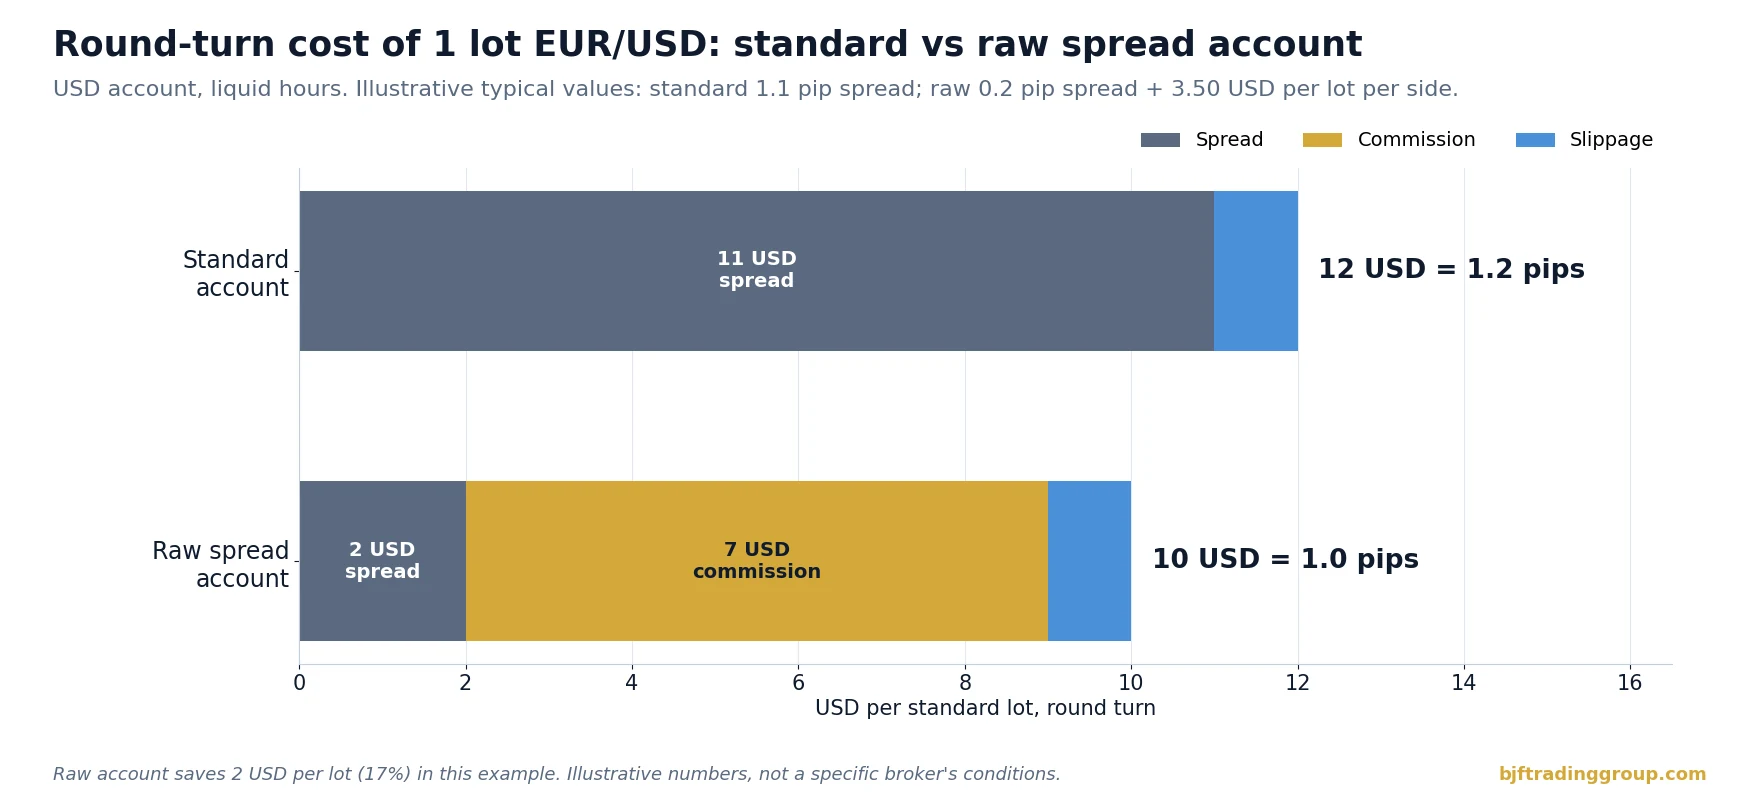
Take one standard lot of EUR/USD, opened and closed during liquid hours, on a USD account. The standard account has an average spread of 1.1 pips; the raw account averages 0.2 pips and charges 3.50 USD per lot per side. Both accounts are assumed to slip by 0.1 pip on average across the round turn.
| Per 1 lot round turn (USD account) | Standard account | Raw spread account |
|---|---|---|
| Average spread | 1.1 pips = 11.00 USD | 0.2 pips = 2.00 USD |
| Commission | 0 | 2 x 3.50 = 7.00 USD (0.7 pips) |
| Average slippage | 0.1 pip = 1.00 USD | 0.1 pip = 1.00 USD |
| Total cost | 12.00 USD = 1.2 pips | 10.00 USD = 1.0 pip |
| Cost of 400 lots a month | 4,800 USD | 4,000 USD |
The raw account saves 2 USD per lot, 17% of the trading cost. On one trade that is nothing; on 400 lots a month it is 800 USD. The example also shows why comparing “1.1 pips” with “0.2 pips” is misleading: the honest comparison is 1.2 pips against 1.0 pip, after the commission has been converted into the same unit.
Same commission, different cost in pips
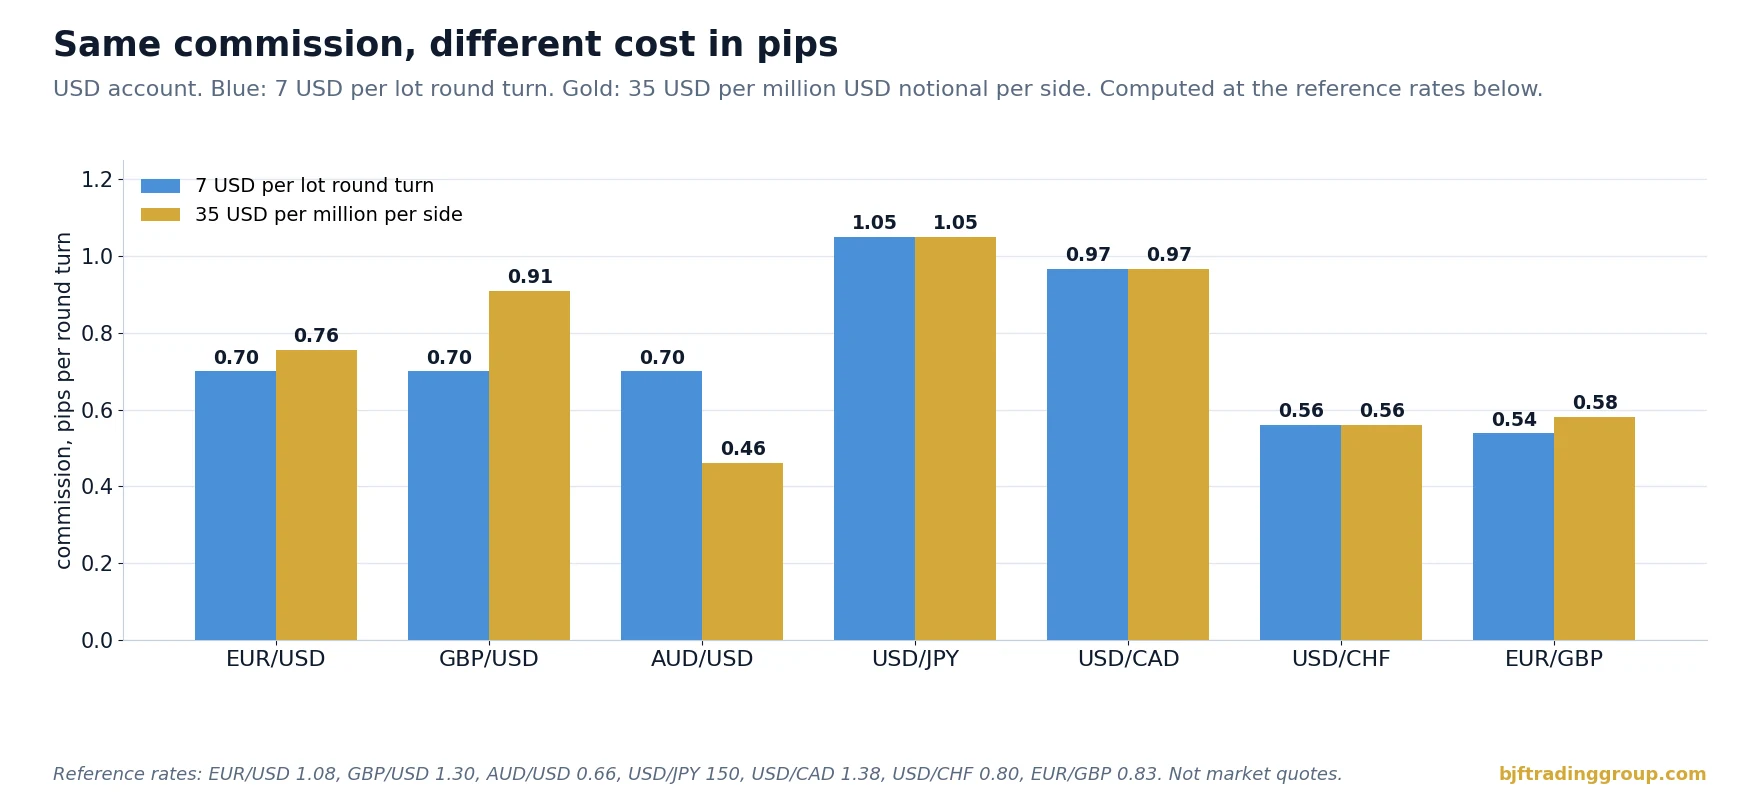
A flat commission per lot looks identical on every pair, but its cost in pips is not, because the value of one pip differs from pair to pair. On a USD account, one pip of a USD-quoted pair (EUR/USD, GBP/USD, AUD/USD) is worth 10 USD per lot. One pip of USD/JPY is 1,000 JPY, which is only about 6.67 USD at 150.00, so the same 7 USD commission costs 1.05 pips. On USD/CHF or EUR/GBP a pip is worth more than 10 USD and the commission costs fewer pips.
| Pair (reference rate) | Pip value per lot, USD | 7 USD per lot round turn, in pips | 35 USD per million per side, in pips |
|---|---|---|---|
| EUR/USD (1.0800) | 10.00 | 0.70 | 0.76 |
| GBP/USD (1.3000) | 10.00 | 0.70 | 0.91 |
| AUD/USD (0.6600) | 10.00 | 0.70 | 0.46 |
| USD/JPY (150.00) | 6.67 | 1.05 | 1.05 |
| USD/CAD (1.3800) | 7.25 | 0.97 | 0.97 |
| USD/CHF (0.8000) | 12.50 | 0.56 | 0.56 |
| EUR/GBP (0.8300, GBP/USD 1.3000) | 13.00 | 0.54 | 0.58 |
Reference rates are round numbers chosen for the calculation, not market quotes. Recalculate with current rates; the pip value of non-USD-quoted pairs changes every day.
Two practical conclusions follow. First, a raw account that is clearly cheaper on EUR/USD can be more expensive on USD/JPY or USD/CAD if the standard account’s spread on those pairs is only slightly wider. Second, per-million pricing favours pairs with a low USD notional (AUD/USD, NZD/USD) and penalizes pairs with a high one (GBP/USD) and, much more strongly, metals: at a hypothetical gold price of 4,000 USD, one lot of 100 ounces is 400,000 USD of notional, and 35 USD per million per side becomes 28 USD per round turn. Always compare per instrument, never per account.
The break-even rule: when raw beats standard
Because slippage and swap are usually similar on both account types, the comparison reduces to one inequality per instrument:
The left side is the broker’s extra markup in the standard account; the right side is what you pay instead in the raw account. In the EUR/USD example the markup is 1.1 – 0.2 = 0.9 pips and the commission is 0.7 pips, so the raw account wins by 0.2 pips per round turn. If the standard account averaged 0.8 pips on the same pair, the two would cost almost exactly the same.
The rule also explains so-called “zero spread” accounts with a higher commission. If the spread is truly zero on average but the commission is 10 USD per round turn, the cost is 1.0 pip on EUR/USD, more than a raw account at 0.2 pips plus 0.7 pips. A cheaper-looking spread can always be paid for with a higher commission, and vice versa; only the total matters.
Cost as a share of your edge, by strategy
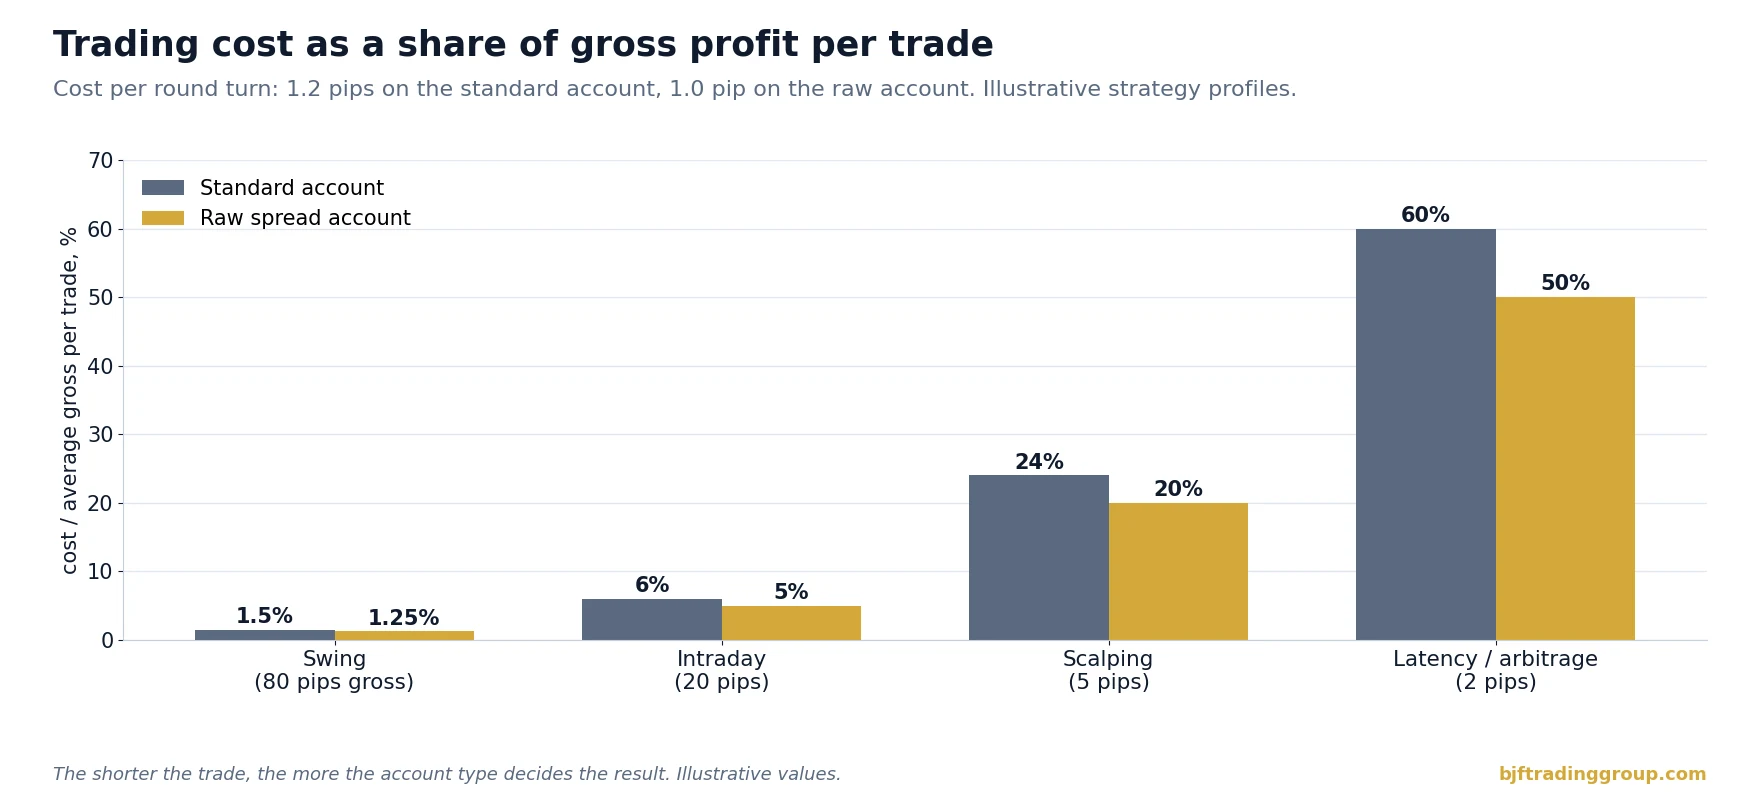
Whether 0.2 pips per round turn matters depends on what each trade earns before costs. The right way to look at trading costs is as a share of the average gross profit per trade.
| Strategy profile (illustrative) | Average gross per trade | Cost share, standard (1.2 pips) | Cost share, raw (1.0 pip) | Does the account type matter? |
|---|---|---|---|---|
| Swing trading | 80 pips | 1.5% | 1.25% | Hardly; swap matters more |
| Intraday trend | 20 pips | 6.0% | 5.0% | Somewhat |
| Scalping | 5 pips | 24% | 20% | Yes |
| Latency / arbitrage | 2 pips | 60% | 50% | Decisive |
For a swing trader, 0.2 pips is noise. For a strategy with a 2-pip gross edge, it is a tenth of everything the strategy earns, and a strategy that costs 1.2 pips on one account and 1.0 on another may be profitable only on the second. That is why algorithmic traders who work on short holding times calculate costs per instrument and per session, and why the same algorithm can show very different results with different brokers.
Quoted vs effective spread
The quoted spread is the difference between the bid and ask on the screen. The effective spread is what you really paid: twice the distance between your fill price and the mid price at the moment you sent the order. If your orders often fill worse than the quote (negative slippage) or the broker rejects and requotes at worse prices, the effective spread is wider than the quoted one, regardless of the account type.
This matters for the account comparison in two ways. First, some brokers’ standard and raw accounts are routed or filled differently, so slippage can differ between them; an account with a cheaper spread but worse fills can end up more expensive. Second, spreads are not stable through the day. Both account types widen at the daily rollover, around major news releases and in thin hours, as explained in our guide to why forex spreads widen. In a raw account the commission stays the same while the spread widens, so its advantage holds in pips but shrinks as a percentage; in a standard account the markup sometimes widens together with the market spread.
| Measurement | How to get it | What it tells you |
|---|---|---|
| Average quoted spread by hour | Record bid/ask ticks and average per hour | The real spread for the hours you trade |
| Average slippage per order | Fill price minus expected price, signed | Execution quality, separate from spread |
| Effective spread | Fill vs mid at order time | Total price cost per trade, the best single number |
| Commission per lot, booked | From the account statement, not the website | What was really charged, including currency conversion |
A broker comparison done with these four numbers is far more reliable than one based on account pages. Our guide to broker execution quality explains how to measure fills and rejections systematically.
Hidden cost details in account conditions
- Commission in a different currency. On a EUR or GBP account, a commission quoted in USD is converted at the broker’s rate, sometimes with a conversion markup. Check the booked amount in your statements.
- Round turn charged at opening. Many platforms book the full round-turn commission when the position opens. Your open trade starts with a visible loss equal to the commission; this is accounting, not an extra fee, but it affects equity-based risk rules.
- Minimum charge per order. Some brokers apply a minimum commission per ticket. For very small orders (micro lots) the effective cost per lot can then be several times higher than the published rate.
- Partial fills. If an order is filled in several parts, commission is normally charged per filled volume, but a per-ticket minimum can apply to every part.
- Different swaps per account type. A broker can charge different swap rates on its raw and standard accounts. For positions held overnight this can outweigh the spread saving; see our swap and rollover guide for how swaps are calculated.
- Volume tiers and rebates. Commission often falls with monthly volume. That rewards concentrating volume on one account rather than spreading it over several brokers.
- Metals, indices and crypto CFDs. Commission rules for non-FX instruments are often different (per contract, per notional, or no commission with a wider spread even on raw accounts). Compare them separately.
- Minimum deposit and leverage differences. Raw accounts sometimes require a larger deposit or offer different leverage. That is not a trading cost, but it decides which account you can actually use.
What algorithmic and arbitrage traders should choose
For automated short-term strategies a commission-based account is usually the better starting point, and not only because it is often cheaper. A fixed commission is predictable: it is the same on every trade and can be modelled exactly in a backtest, while a markup hidden in a variable spread changes with the hour, the pair and the broker’s pricing policy. That predictability makes thresholds, such as the minimum price difference an arbitrage system needs before it trades, easier to set correctly.
Arbitrage strategies have an extra twist: they usually trade two legs. In a hedge or lock arbitrage across two brokers, both positions pay their full round-turn cost, so the total cost per opportunity is the sum of both accounts. In latency arbitrage, where a fast price feed is compared with a slower broker quote, only one account trades, but the typical gross edge per trade is so small that a few tenths of a pip in costs decide whether the strategy works at all.
| Setup (illustrative, EUR/USD) | Legs paying costs | Total cost, both standard (1.2 pips each) | Total cost, both raw (1.0 pip each) |
|---|---|---|---|
| Latency arbitrage, one broker | 1 | 1.2 pips | 1.0 pip |
| Hedge / lock arbitrage, two brokers | 2 | 2.4 pips | 2.0 pips |
| Three-pair triangular trade, one broker | 3 | about 3.6 pips | about 3.0 pips |
In practice the account type is only one cost lever. For arbitrage and latency strategies execution quality, latency to the broker’s server and the broker’s reaction to the strategy matter as much as the commission. Before choosing, read our overview of brokers suitable for forex arbitrage, which covers execution models and what to look for beyond the fee table.
Step by step: calculate your real cost per lot
1
2
3
4
5
6
7
To see how often price differences between a fast feed and broker quotes are larger than your full cost per round turn, you can watch them in real time with the free forex arbitrage scanner. It shows gross price differences; your cost model is what tells you which of them are tradable.
Risks and limitations
- Illustrative numbers. The spreads, commissions and rates in this article are typical round values chosen to show the method, not offers of a specific broker. Use your broker’s actual conditions.
- Averages hide extremes. A low average cost does not protect you from wide spreads at rollover or during news; your strategy needs its own filters for those moments.
- Costs are not the only difference. Execution model, fill quality, rejections and the broker’s policy towards short-term strategies can matter more than 0.2 pips of cost.
- Conditions change. Brokers revise spreads, commissions and swaps. A comparison that was right last quarter may be wrong now.
- Lower costs do not create an edge. A cheaper account improves a strategy that already has a positive gross result; it cannot turn a losing strategy into a winning one.
- Regulation and availability. Account types, leverage and conditions differ by country and regulator. Trade only with brokers and products that are legal and available to you.
Put your cost model to work
BJF Trading Group builds arbitrage and high-frequency trading software for forex and crypto markets. SharpTrader runs latency and lock arbitrage strategies for forex and crypto markets, and its thresholds can be set to match the real cost structure of each account. Start by measuring real price differences with the free scanner, then compare them with your cost per lot.
Free arbitrage scanner + short email course
Get the free scanner link and a few short, practical emails from Boris: what a price gap really means after costs, how to test a strategy before risking real money, and which tools fit your market. No hype.
FAQ
Is a raw spread account always cheaper than a standard account?
No. A raw account is cheaper only when the standard account’s extra spread is larger than the commission expressed in pips. On major pairs that is usually true by a few tenths of a pip, but on some pairs, such as USD/JPY, or with high per-million commissions on metals, the standard account can cost the same or less.
How do I convert a forex commission into pips?
Take the round-turn commission per lot in your account currency (double it if it is quoted per side) and divide it by the pip value of one lot of that pair in the same currency. On a USD account, 7 USD per round turn on EUR/USD, where one pip is worth 10 USD, equals 0.7 pips.
What does 3.50 per lot per side mean?
It means 3.50 is charged when the position is opened and another 3.50 when it is closed, so one complete trade of one standard lot costs 7.00 in commission. Many platforms book the full 7.00 at the opening of the trade.
What is the difference between per-lot and per-million commission?
A per-lot commission is the same amount for every lot regardless of price. A per-million commission is a rate on the USD value traded, so it costs more on pairs and instruments with a high notional value, such as GBP/USD or gold, and less on pairs with a low one, such as AUD/USD.
Which account type is better for scalping and algorithmic trading?
Usually a commission-based raw spread account, because short-term strategies earn only a few pips per trade, so a few tenths of a pip of cost is a large share of the result, and because a fixed commission is easier to model in backtests than a variable markup. Confirm it with your own spread and slippage measurements.
Why are my live results different on two accounts with the same strategy?
Mostly because of measurable cost differences: average spread in your trading hours, commission converted into pips, slippage and swap. Differences in execution, such as rejections or delayed fills, also play a role. Measure each component separately to find the cause.
Does the account type affect swap and rollover costs?
It can. Some brokers use different swap rates for their raw and standard accounts, and both account types usually see wider spreads at the daily rollover. For positions held overnight, compare the swaps of both accounts as well as the spread and commission.
