Why Forex Spreads Widen: Rollover, News, Thin Liquidity and How Algorithms Handle It Monday October 26th, 2026 – Posted in: Arbitrage Software, Forex trading
Why Forex Spreads Widen: Rollover, News and Thin Liquidity
A EURUSD spread of 0.2 pips can turn into 3 pips at 17:00 New York time, and into 10 pips in the first second after a major data release. Nothing is broken when that happens: it is how the interbank market is built. This guide explains why spreads widen, when it happens, what it costs different strategies in real numbers, how to measure your own broker’s spread profile, and how trading algorithms protect themselves from it.
- What spread widening is (with numbers)
- Where the spread comes from
- Rollover: why spreads widen at 17:00 New York
- News releases: the spread before, during and after
- Thin sessions, holidays and the weekend open
- Unscheduled shocks
- Broker-side causes
- What widening costs different strategies
- Hidden effects: stops, pending orders and margin
- How to measure your broker’s spread profile
- How algorithms handle spread widening
- Spread widening in latency arbitrage
- Common mistakes
- FAQ
What spread widening is (with numbers)
Short answer: the spread is the difference between the bid (the price you can sell at) and the ask (the price you can buy at). Spread widening is a temporary increase of that difference, usually because fewer liquidity providers are quoting, or because they quote more cautiously. The three classic moments are the daily rollover around 17:00 New York time, scheduled economic releases, and thin trading periods such as holidays and the Sunday open.
Take a raw-spread account on EURUSD. During the London and New York overlap the quote is typically 1.08500 / 1.08502: a spread of 0.2 pips. At the daily rollover the same broker may show 1.08490 / 1.08520: 3.0 pips. In the first second after US non-farm payrolls it may briefly show 1.08460 / 1.08560: 10 pips. The mid price hardly moved in the rollover case; the market simply became more expensive to cross.
For one standard lot (100,000 units) a pip on EURUSD is worth about $10. Crossing the spread once costs $2 at 0.2 pips, $30 at 3 pips and $100 at 10 pips. A strategy that opens and closes positions at the wrong moment pays that difference every time, and no price chart built from bid prices will show it.
Indicative ranges collected from typical ECN/STP conditions. Every broker, account type and instrument has its own profile; measure yours as shown below.
Where the spread comes from
Forex has no central exchange. The market traded about $9.6 trillion per day in April 2025 according to the BIS Triennial Survey, but that volume is spread across banks, non-bank market makers, ECNs and brokers. A retail or professional broker usually aggregates quotes from several liquidity providers (LPs). Your bid is the best bid among them, your ask is the best ask, and the broker may add a markup on top.
That gives a simple rule: the spread you see depends on how many LPs are quoting, how much size they show at the top of the book and how much risk they want to take right now. Anything that reduces the number of active quotes or makes LPs more careful widens the spread. Three groups of reasons do that:
- Fewer participants: the end of the New York day, holidays, the weekend open, the hours between the US close and the Tokyo open.
- Higher uncertainty: a scheduled release in a few seconds, a central bank decision, an unexpected headline.
- Technical and business reasons: LP system maintenance at the day end, broker markups, wider spread groups for specific clients, instruments with little natural liquidity.
Rollover: why spreads widen at 17:00 New York
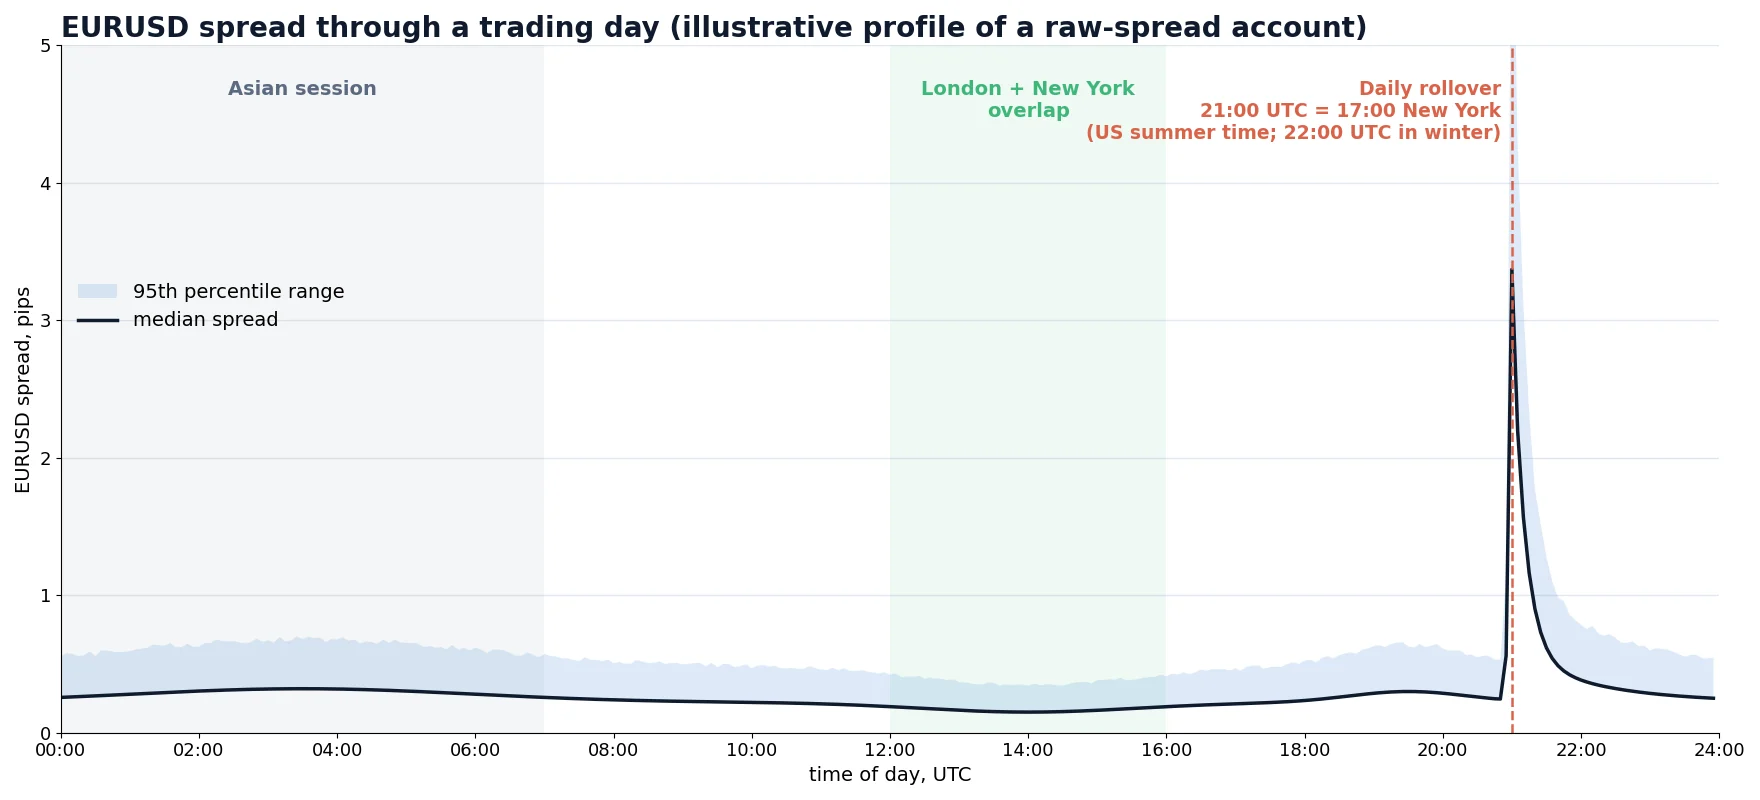
The forex trading day ends at 17:00 New York time. That is 21:00 UTC while the US is on daylight saving time and 22:00 UTC in winter. At this moment the value date of spot positions moves one business day forward, open positions receive or pay the overnight swap, and many systems switch to a new trading day.
Several things happen at once, and each of them pulls liquidity out of the market:
- LPs roll their books. Banks and market makers move positions to the next value date and recalculate risk. Many of them stop streaming or stream only small size for a few minutes.
- Systems restart. Some LPs and ECNs have a short maintenance break around the day end. Some brokers also pause trading for a few minutes.
- The natural flow is gone. US corporates and funds have finished their day, Tokyo has not started and Sydney has only just opened. Real two-way business is at its daily minimum.
- The remaining LPs protect themselves. With fewer competitors and nobody to offset risk, they quote wider. The aggregated top of book is formed by fewer and more cautious quotes.
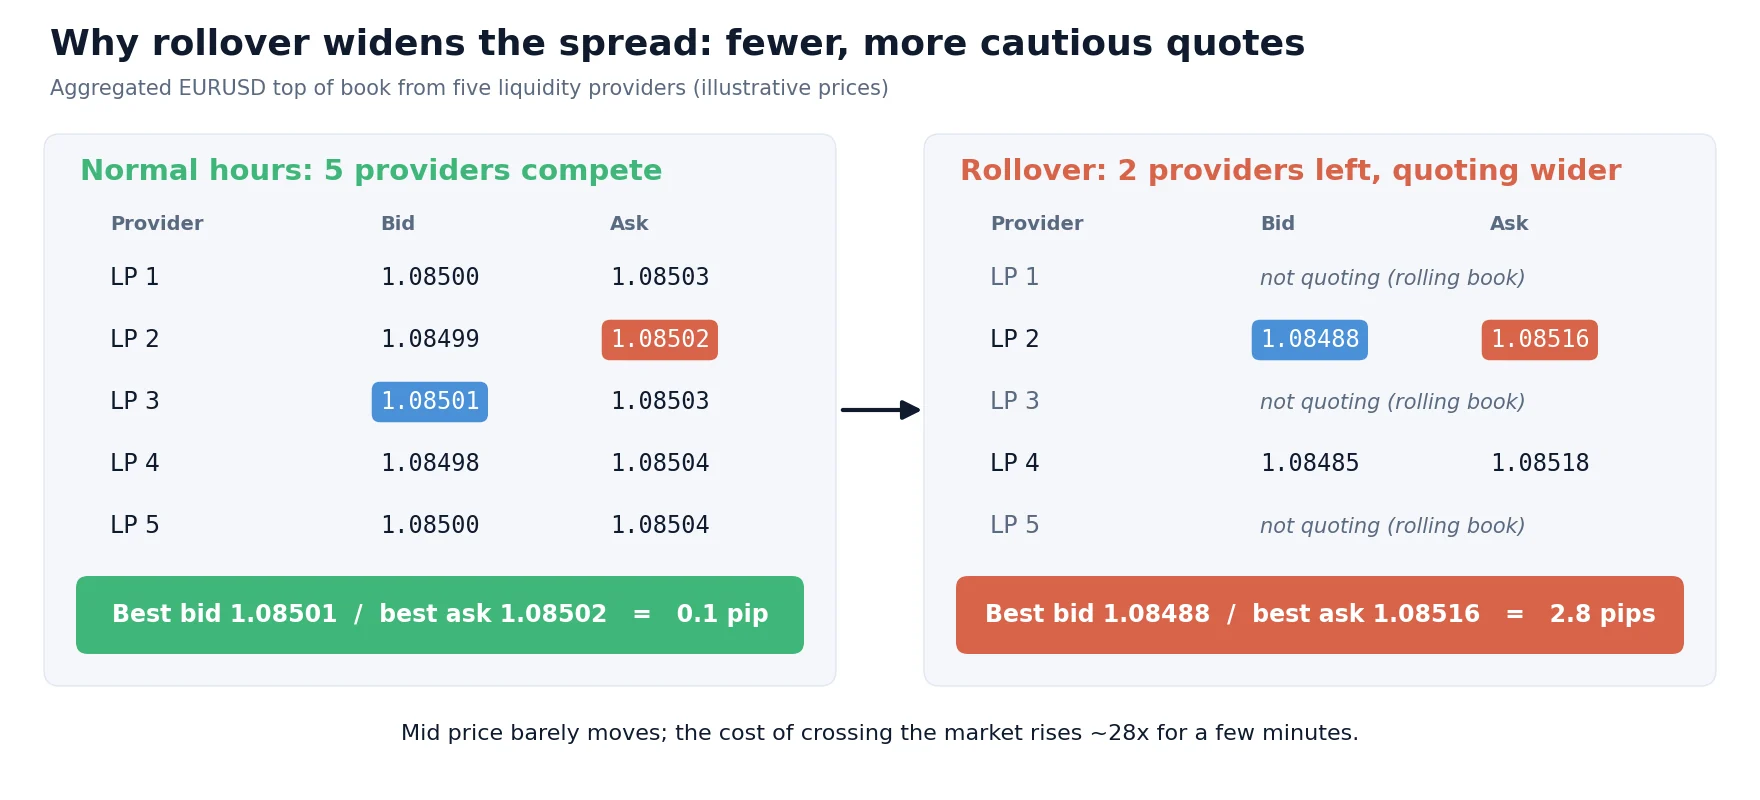
On majors the widening usually lasts from a few minutes to about 30 minutes, with the peak in the first minutes after 17:00. On crosses, exotics and metals it is larger and lasts longer, often until Tokyo liquidity arrives. On Wednesday the triple swap is charged at the same moment (to cover the weekend value dates), which matters for strategies that hold positions overnight; see our guide to swap arbitrage for how swaps are calculated.
News releases: the spread before, during and after
Scheduled releases such as US non-farm payrolls, CPI, central bank rate decisions and press conferences create a very specific spread pattern. The spread usually starts to widen 10 to 60 seconds before the release as LPs pull quotes or reduce size: nobody wants to be the last price on the screen when the number comes out. In the first second after the release the spread is at its widest, and quotes can jump several pips at once. Then, as LPs see the number and the direction settles, they return and the spread decays to normal, usually within 1 to 5 minutes on majors.
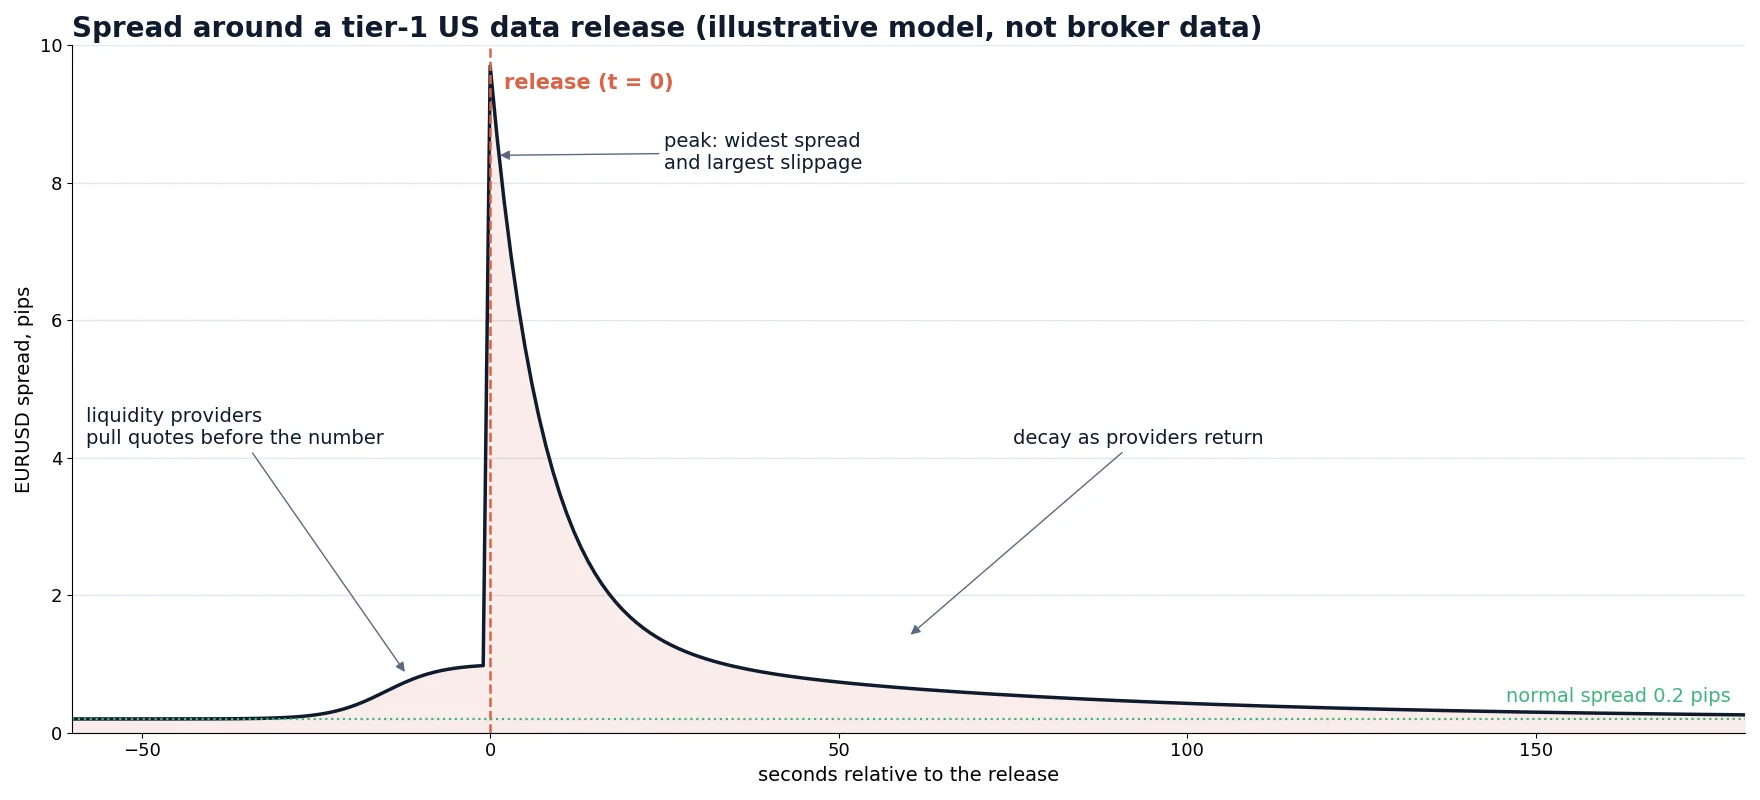
Two practical consequences follow. First, a market order sent at the moment of the release pays the widest spread and the largest slippage at the same time; our forex slippage guide shows how these two costs add up. Second, the move after the release is often real, and some strategies are built to trade it. If you are interested in that side of the market, read how economic news trading works and why speed matters there.
| Event | Typical widening starts | Peak | Back to normal (majors) | Most affected |
|---|---|---|---|---|
| US non-farm payrolls, CPI | 10–60 s before | 0–2 s after | 1–5 min | USD pairs, gold, US indices |
| Central bank rate decision | 30–120 s before | Decision and press conference | Several minutes, repeats during Q&A | The currency of that bank |
| Daily rollover | 1–5 min before 17:00 NY | First minutes after 17:00 NY | 5–30 min | Crosses, exotics, metals |
| Sunday open | Market opening | First minutes | Often until Tokyo opens | All pairs, especially after weekend news |
Indicative timings from typical ECN/STP conditions. Use them as a starting point and confirm on your own data.
Thin sessions, holidays and the weekend open
Outside the big events, spreads follow the liquidity of the trading sessions. They are tightest when London and New York overlap (roughly 12:00–16:00 UTC), tight during the London morning, slightly wider in the Asian session for EUR and GBP pairs, and widest in the late New York afternoon and around rollover.
Holidays have the same effect for a whole day: Christmas and New Year, US Thanksgiving and the following Friday, bank holidays in the UK, Golden Week in Japan. On these days many desks are closed, some LPs quote with reduced size and spreads stay wider than usual even at times that are normally liquid.
The weekend open deserves its own mention. When the market opens on Sunday evening (around 17:00 New York time), only a few participants are active and weekend news has to be priced in at once. Prices can open away from Friday’s close (a gap) and spreads on majors can stay several times wider than normal for the first hour. Pending orders that sit inside the gap are filled at the first available price, not at their order price.
Unscheduled shocks
Scheduled events can be planned for. Shocks cannot. When the Swiss National Bank removed the EURCHF floor on 15 January 2015, liquidity in CHF pairs disappeared for minutes and quoted spreads became meaningless. On 3 January 2019, in the thin early Asian hours of a holiday period, JPY pairs dropped several hundred pips within minutes in a “flash crash” before recovering. In both cases the spread was not the cost of a trade any more; it was a sign that there was no market at a reasonable price.
No filter makes a strategy immune to this. What helps is position sizing that survives a gap, not holding large positions through the thinnest hours without a reason, and software that stops sending orders when quotes become abnormal instead of chasing them.
Broker-side causes
Not every widening comes from the interbank market. Some typical broker-side reasons:
- Markups. A standard account may add a fixed or percentage markup to the raw spread. A percentage markup widens together with the raw spread.
- Fixed-spread accounts. They show a constant spread in normal conditions, but the terms usually allow the broker to widen it or to requote in “abnormal market conditions”, which often means exactly rollover and news.
- Spread groups. Some brokers assign clients to groups with different spread profiles. Two accounts at the same broker can see different spreads at the same second.
- Few LPs. A broker connected to one or two providers has less competition at the top of the book, so any provider leaving the stream widens the spread more.
If your spread is regularly wider than at other brokers at the same moment, or widens only on your account, that is an execution question rather than a market one. Our page on broker execution transparency explains how to check it with your own data, and the broker selection guide lists what to look at before you open an account.
What widening costs different strategies
The same 3-pip rollover spread means very different things depending on how much a strategy earns per trade. The table compares four styles on EURUSD with one standard lot. “Normal cost” uses a 0.2-pip spread plus $6 round-trip commission (about 0.6 pips); “rollover cost” uses a 3-pip spread with the same commission.
| Strategy | Average gross result per trade | Cost in normal hours | Cost at rollover | Share of edge at rollover |
|---|---|---|---|---|
| Swing trading | 60 pips | 0.8 pips (1.3%) | 3.6 pips | 6% |
| Intraday | 15 pips | 0.8 pips (5%) | 3.6 pips | 24% |
| Scalping | 4 pips | 0.8 pips (20%) | 3.6 pips | 90% |
| Latency arbitrage | 1.2 pips | 0.8 pips (67%) | 3.6 pips | 300% (a loss) |
Calculated example. Real results depend on the broker, the instrument and the exact timing of entries and exits.
A swing trader barely notices rollover. For a scalper, one entry at the wrong minute wipes out almost the entire average trade. For an arbitrage or high-frequency strategy, a trade opened in a wide spread starts with a loss larger than the whole expected profit. That is why serious short-term systems never treat the spread as a constant.
Hidden effects: stops, pending orders and margin
Most charts are drawn from bid prices. Orders are triggered by the side of the quote they trade against: buy orders by the ask, sell orders by the bid. When the spread widens, the ask moves away from the bid even if the chart line does not move. That creates effects many traders only discover in their account history.
Stop loss on a short position
You are short EURUSD with a stop at 1.08600. The bid is 1.08560 and the spread is 0.2 pips, so the ask is 1.08562: your stop is 3.8 pips away. At rollover the spread widens to 4.5 pips and the ask becomes 1.08605. The stop (a buy order, triggered by the ask) is executed, although the bid on your chart never came closer than 4 pips to the stop. The fill is about 4.5 pips above the chart price: roughly $45 per lot lost only because of the spread.
Pending orders
The same logic applies to buy limit, buy stop and take-profit orders on short positions. A take-profit on a short position can be “missed” if the ask did not reach it, even though the bid did. And a buy stop placed close to the market can be triggered by a spread spike and filled at a poor price.
Margin and stop-out
Floating profit and loss is usually calculated at the closing side of the quote. When the spread widens, every open position looks worse for a few minutes. An account running close to its margin limit can hit a stop-out at rollover, even if the market itself did not move against it.
How to measure your broker’s spread profile
Published “average spreads” are averages over the whole day and say little about the moments that hurt. A spread profile of your own account takes a couple of weeks of data and answers the useful questions: how wide, when, for how long, and compared to what.
1
2
3
4
5
6
Two numbers are especially useful. The median of the quiet hours tells you what “normal” is. The 95th percentile of the rollover and news buckets tells you how far a protective stop must be and where a spread filter should cut off. If you want a ready check-list for this kind of analysis, use our forex broker audit toolkit.
How algorithms handle spread widening
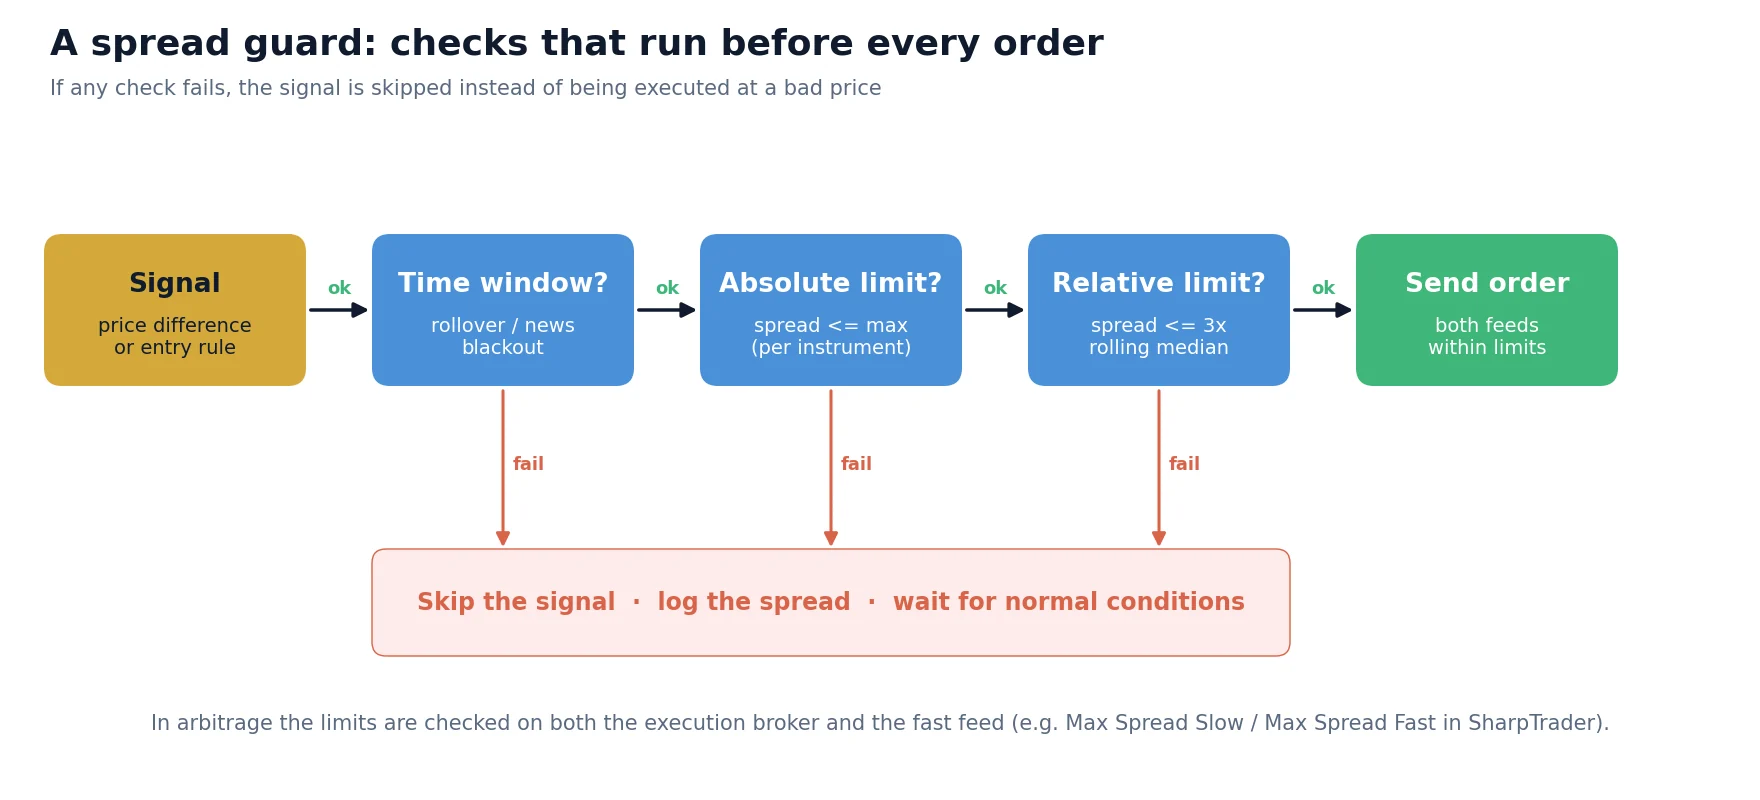
Good trading software treats the spread as a live input, not as a constant. There are five common protections, and the strongest systems use several of them together.
1. Absolute maximum spread
The simplest filter: no new order if the current spread is above a fixed value, for example 0.8 pips on EURUSD. It is easy to understand and automatically covers rollover, news and thin hours, whatever their exact time. Its weakness is that one value does not fit all instruments and sessions.
2. Relative spread filter
The algorithm compares the current spread with a rolling median of the last 15–60 minutes and refuses to trade if it is more than, say, 2.5 to 3 times higher. If the median is 0.3 pips, the limit becomes 0.9 pips; if the median in the Asian session is 0.6, the limit becomes 1.8. The filter adapts to the session and to the instrument without retuning.
3. Time windows
A blackout around rollover (for example 16:55–17:30 New York time) and around scheduled releases (for example 2 minutes before to 5 minutes after). Time windows catch the risk before the spread has widened, which a pure spread filter cannot do. Define them in New York time or in the exchange time zone of the instrument, not in a fixed UTC offset.
4. Spread-aware exits
Entries are only half of the problem. A strategy can delay non-urgent exits until the spread normalises, avoid closing at market in the first seconds after a release, and place protective stops beyond the 95th-percentile rollover spread. The exit logic should know which side of the quote it is trading against.
5. Realistic backtests
A backtest with a constant spread overstates any short-term strategy, because it never pays rollover and news spreads. Test on tick data with real bid and ask prices and with execution delay, as described in our article on the gap between backtests and real execution. If the strategy only works with the spread of the best hour of the day, it does not work.
| Protection | Catches | Misses | Best for |
|---|---|---|---|
| Absolute max spread | Any widening above the limit | Moments before widening starts; sessions with different normal spreads | Single instrument, simple setups |
| Relative spread filter | Abnormal spread for the current session | Slow drifts in the median | Many instruments, 24-hour strategies |
| Time windows | Known events, before the spread reacts | Unscheduled shocks | Rollover and news calendars |
| Spread-aware exits | Stops and closes in wide markets | Nothing on entries | Strategies that hold positions overnight |
| Tick-data backtests | Overstated results before going live | Future changes of broker conditions | All short-term strategies |
Spread widening in latency arbitrage
In latency arbitrage a strategy compares the price of a slow broker with a fast reference feed and trades when the slow price lags behind. Spread widening hits this kind of strategy twice. First, a wide spread on the slow broker can create a price difference on paper that cannot be traded at a profit, because entering and exiting crosses the wide spread. Second, a wide spread on the fast feed means the reference price itself is uncertain, so the “signal” may be nothing more than noise between two cautious quotes.
In SharpTrader this is handled by two separate limits: Max Spread Slow (the largest spread allowed on the broker where orders are executed) and Max Spread Fast (the largest spread allowed on the fast data feed). If either current spread is above its limit, the signal is ignored no matter how large the price difference looks. A news filter can additionally pause trading in configurable windows before and after high-impact releases. In our experience with arbitrage setups, tightening these two limits removes most of the “big but false” signals that appear at rollover and around news, at the price of skipping some real opportunities. Like every parameter, they should be tested on tick data for the specific broker rather than copied from another account.
Let the software check the spread before every order
SharpTrader runs forex and crypto arbitrage strategies with separate spread limits for the execution broker and the fast feed, plus a news filter. SharpTrader Optimizer lets you test those settings on real tick data with realistic execution time. Start with the free scanner to see how your broker’s prices compare with faster sources.
Common mistakes
- Judging a broker by its advertised average spread. The average hides exactly the minutes when spreads matter. Compare medians and 95th percentiles by time of day.
- Hard-coding rollover in UTC. The UTC time moves twice a year, and Europe and the US change clocks on different dates.
- Backtesting with a fixed spread. It makes scalping and arbitrage strategies look far better than they are.
- Forgetting the ask side. Stops and take-profits on short positions are triggered by the ask, which the chart usually does not show.
- Treating every spike as broker manipulation. Rollover and news widening is normal market behaviour. It becomes a broker question only when your account is consistently worse than the market at the same second.
- Setting one filter for all instruments. 0.8 pips is a sensible limit for EURUSD and useless for GBPJPY or gold. Use per-instrument or relative limits.
Free arbitrage scanner + short email course
Get the free scanner link and a few short, practical emails from Boris: what a price gap really means after costs, how to test a strategy before risking real money, and which tools fit your market. No hype.
FAQ
Why do forex spreads widen at 5 pm New York time?
17:00 New York time is the end of the forex trading day. Liquidity providers roll positions to the next value date, recalculate risk and sometimes restart systems, while US participants have finished and Asian ones have not started. Fewer and more cautious quotes mean a wider spread for a few minutes, longer on crosses and metals.
How long does spread widening at rollover last?
On major pairs usually from a few minutes to about 30 minutes, with the peak right after 17:00 New York time. On crosses, exotics and gold it can last until Tokyo liquidity arrives. Measure it on your own broker, because the duration differs between providers.
Why do spreads widen during news?
Before a scheduled release liquidity providers reduce size or pull quotes, because nobody wants to be filled at an old price when the number comes out. Right after the release the uncertainty is highest, so the remaining quotes are wide. As the market absorbs the number, providers return and the spread usually normalises within a few minutes on majors.
Can spread widening trigger my stop loss?
Yes, on short positions. A stop on a short position is a buy order and is triggered by the ask. If the spread widens enough, the ask can reach the stop while the bid shown on the chart stays well away from it. Keep such stops further away than the usual rollover spread or manage positions before the window.
Is spread widening a sign of a bad broker?
Not by itself. Widening at rollover, around news and in thin hours is normal market behaviour. It becomes a concern when your spread is regularly wider than other brokers or a fast reference feed at the same moment, or when it widens only on your account.
When are forex spreads the tightest?
Usually during the overlap of the London and New York sessions, roughly 12:00 to 16:00 UTC, and during the London morning. Spreads are generally wider in the late New York afternoon, around rollover, on holidays and in the first hour after the Sunday open.
Do fixed-spread accounts protect against widening?
Only partly. A fixed spread is usually wider than the raw spread in normal hours, and account terms often allow the broker to widen spreads or requote in abnormal market conditions, which typically include news and rollover. Read the terms before relying on it.
