Forex Tick Data for Backtesting: Sources, Quality Checks and Pitfalls Saturday October 31st, 2026 – Posted in: Arbitrage Software, Forex trading
Forex Tick Data for Backtesting: Sources, Quality Checks and Pitfalls
A backtest can only be as honest as the prices you feed it. For scalping, arbitrage and any strategy that lives inside a few pips, one-minute bars are not enough: you need the real sequence of bid and ask quotes. This guide explains where forex tick data comes from, why two datasets for the same pair never match, which quality checks to run before trusting a result, and how to turn raw ticks into a test that resembles live trading.
- What forex tick data is
- Tick data vs bar data: what interpolation hides
- Where forex tick data comes from
- Your broker’s feed vs a reference feed
- Timestamps, time zones and daylight saving
- Quality checks before you trust a dataset
- Step by step: preparing tick data for a backtest
- Variable spread: the cost a fixed spread hides
- How much the data assumption changes the result
- Ticks are necessary, not sufficient: execution time
- Storage, formats and handling
- Common pitfalls
- FAQ
What forex tick data is
Short answer: forex tick data is the record of every quote change in a currency pair: a timestamp (usually in milliseconds), the bid price, the ask price and sometimes the quoted volume at each side. Unlike bar data, which keeps only the open, high, low and close of each period, tick data preserves the order, timing and spread of every price update, which is what a short-term strategy actually trades on.
A typical row looks like this:
That is the time, the bid, the ask, and the volume available at the bid and the ask (in millions, if the source provides it). The spread on this tick is 0.7 pips. One second later there may be five more rows, or none at all.
There is one thing to understand before anything else: the spot forex market has no central tape. Equities and futures have an exchange that publishes the official sequence of trades. Forex is traded over the counter across many banks, ECNs and brokers, and each of them streams its own quotes. So every forex tick dataset is one venue’s or one aggregator’s view of the market. Two sources can disagree by a fraction of a pip and by tens of milliseconds at the same moment, and both can be correct for their own venue.
That fact drives most of this guide. “Is this tick data accurate?” is the wrong question. The useful questions are: accurate for which execution venue, recorded how, and cleaned how?
Quote ticks vs trade ticks
Most forex datasets are quote ticks: changes of the best bid or best ask. They are not trades. A quote can change ten times without a single deal, and a large trade may not change the top of book at all. Some futures-based or exchange-traded FX data contains trade ticks (last price and size), but for spot forex backtesting you want bid and ask quotes, because that is what your orders will be filled against: buys at the ask, sells at the bid.
Tick data vs bar data: what interpolation hides
Many backtesting tools that claim to test “every tick” do not use recorded ticks at all. They take one-minute bars and generate synthetic ticks inside each bar, typically a smooth path from the open to the high and the low and on to the close. The result looks like tick data, but it contains no information that the bar did not already have.
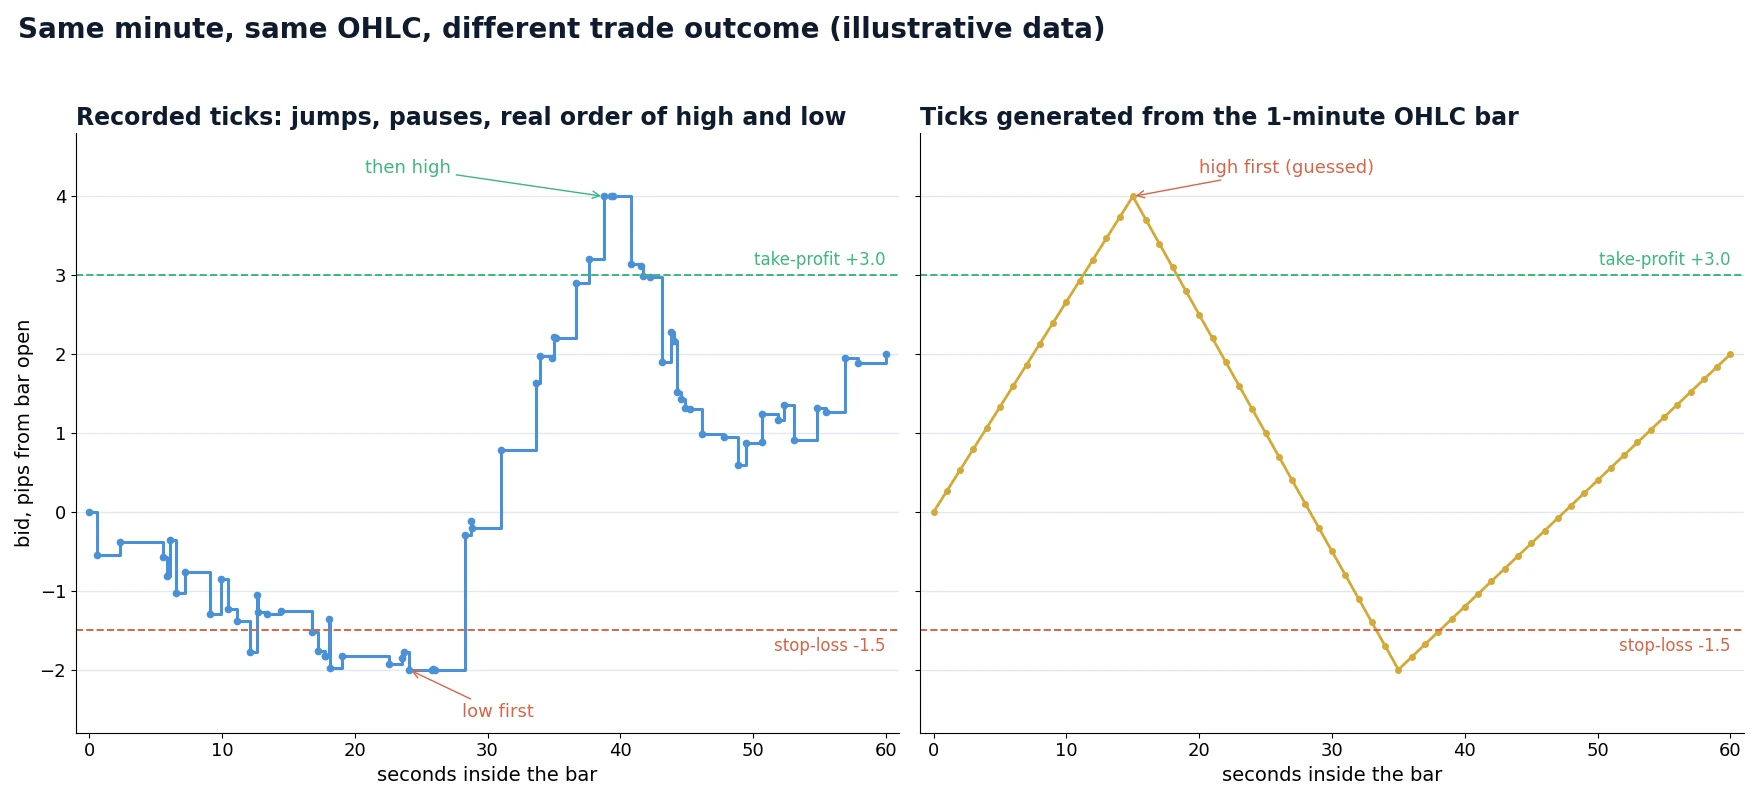
Here is why that matters. Take a one-minute EUR/USD bar: open 1.08500, high 1.08540, low 1.08480, close 1.08520. A long position is open with a take-profit at 1.08530 and a stop-loss at 1.08485. Both levels are inside the bar. Did the trade win or lose?
- If the low came first, the stop was hit at 1.08485 and the trade lost 1.5 pips.
- If the high came first, the take-profit was hit at 1.08530 and the trade won 3 pips.
The bar cannot tell you. The generator picks an order (often by a fixed rule, such as “a bullish bar goes to the low first”), and the backtest reports a confident result that is partly a coin flip. For a swing strategy with a 100-pip target this rarely matters. For a strategy whose targets and stops sit within a few pips of entry, it decides a large share of trades.
Interpolation also erases three things that recorded ticks keep:
| What the strategy needs | Recorded ticks | Ticks generated from bars |
|---|---|---|
| Order of the high and low inside a minute | Exact | Guessed by a rule |
| Price jumps (a 1.5-pip move in one quote) | Present | Smoothed into small steps |
| Spread on every quote | Present (bid and ask) | Usually one fixed spread or one value per bar |
| Timing between quotes (quiet vs busy seconds) | Present | Evenly spaced or invented |
| Quote activity around news and rollover | Present | Lost |
Jumps are the critical point for latency arbitrage: the signal is the jump. A synthetic path that walks from 1.08500 to 1.08515 in fifteen small steps produces no signal at all, so a strategy that would trade live looks dead in the test, or a strategy that buys pullbacks looks better than it is.
Where forex tick data comes from
There are five realistic sources. They differ in cost, depth and, most importantly, in how closely they match the prices you will actually trade.
| Source | What you get | Strengths | Limitations |
|---|---|---|---|
| Your own recording (via the broker’s API or FIX session) | Every quote your account received, with your local receive time | Exact match to your execution venue; you control timestamps and format | Starts only when you start recording; needs a stable machine; gaps if the connection drops |
| Broker history download | Historical bid/ask from the broker’s own feed | Close to your venue; often years of history | Quality varies; some brokers thin out or filter old ticks; timestamps may be in server time |
| Free public archives (offered by some ECN brokers and aggregators, e.g. Dukascopy, TrueFX, HistData.com) | Bid/ask ticks for major pairs, often back to the 2000s | Free, long history, good for research and robustness tests | One venue’s or aggregator’s view, not yours; spreads and quote frequency differ from your broker; check each source’s time zone convention |
| Commercial data vendors | Cleaned, normalized multi-venue tick history | Documented methodology, consistent formats, support | Expensive; still not your broker’s feed |
| Reference / fast feeds (e.g. BJF Feed tick history from London, Tokyo and New York nodes) | A fast, independent reference price stream | Needed to test strategies that compare a slow feed with a fast one | Has to be paired with the broker’s own ticks for arbitrage tests |
The practical rule: use the longest clean history you can get for research, and the closest-to-your-venue data for the final decision. A strategy that only works on one free archive and fails on your broker’s recorded ticks does not work. A strategy that holds up on both, with realistic costs, has passed a meaningful test.
If you plan to run a strategy for months, start recording your own broker’s ticks today, even before the strategy is finished. Three months of your own feed is worth more for the final check than ten years of someone else’s.
Your broker’s feed vs a reference feed
Because each venue streams its own quotes, the same instant looks slightly different from different places. The differences have a structure:
- Price offset. Mid prices typically agree within a fraction of a pip in liquid hours and drift apart in thin markets, at rollover and around news.
- Time offset. A broker that aggregates prices from liquidity providers, applies its own markup and runs risk checks will often show a move later than a fast reference feed. The lag can be a few milliseconds or several hundred.
- Quote frequency. Some feeds send every change, others throttle (for example, at most one update per 100 ms per symbol). A throttled feed has fewer ticks and larger jumps.
- Spread profile. A raw ECN feed and a retail feed with markup can differ by a full pip in average spread and much more at rollover.
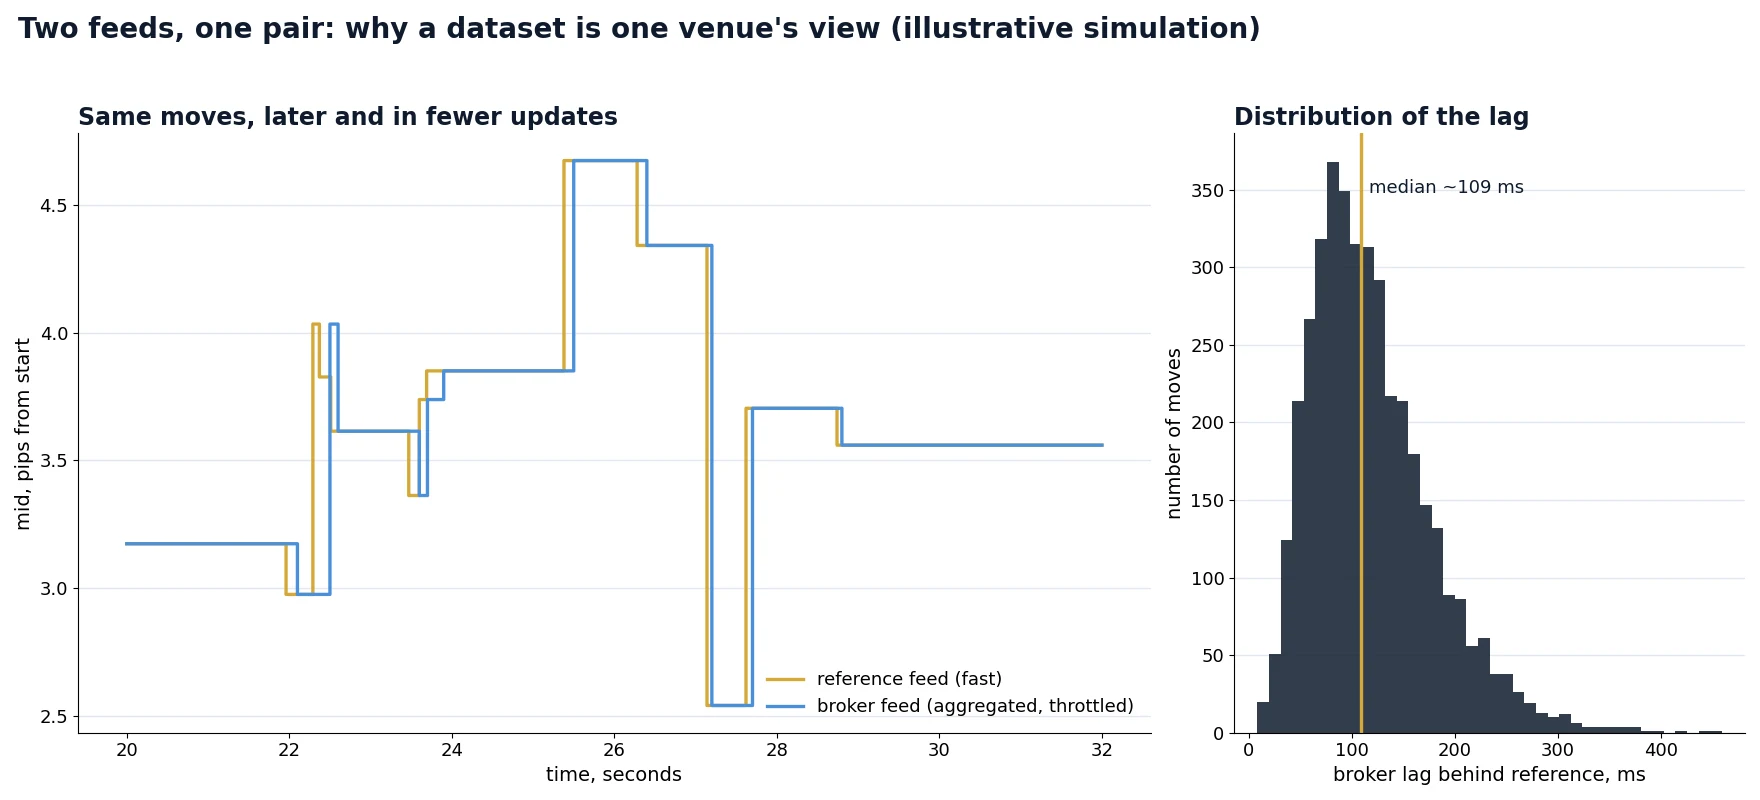
For most strategies, this means you should test on the feed you will trade on. For latency arbitrage it means something stronger: the strategy’s edge is the difference between two feeds, so you need both streams, recorded with timestamps from the same clock. Testing an arbitrage strategy on one vendor’s ticks is meaningless. We describe how to compare feeds tick by tick in our article on tick comparison in forex arbitrage and HFT, and why the reference side has to be fast in the guide to fast data feeds for arbitrage.
Timestamps, time zones and daylight saving
Timestamp problems cause more silent backtest errors than bad prices. Four things to check:
1. Which time zone is the data in?
Common conventions are UTC/GMT, US Eastern time (with or without daylight saving) and broker “server time”, which many brokers set to GMT+2 in winter and GMT+3 in summer so that the trading day closes at 17:00 New York time. If your strategy says “trade the London open at 08:00”, a one-hour offset means it trades a different market regime.
2. Is daylight saving applied, and whose?
Europe and the United States switch clocks on different dates. For about three weeks in March and one week around late October and early November, the gap between London and New York is four hours instead of five. A dataset converted with the wrong rule shifts session-based logic by an hour during those weeks. The error is small, seasonal and very hard to notice in an equity curve.
3. Where was the timestamp taken?
A tick can carry the time the venue generated the quote, the time it left the venue’s server, or the time your machine received it. For a trend strategy the difference does not matter. For latency-sensitive strategies it is the whole question: two feeds can only be compared if both are stamped on the same clock, ideally your own receive time synchronized with NTP or PTP.
4. Resolution and ordering
Second-resolution timestamps are not enough for short-term work: dozens of quotes can share the same second, and their order inside it may be lost after sorting. Use millisecond (or finer) resolution and keep the original file order as a tie-breaker.
Quality checks before you trust a dataset
Raw tick data always contains errors. The goal is not perfection, but to know what is in the data and to remove what would distort the test. These are the checks we run on any new dataset before using it in an optimization:
| Check | What to look for | Typical action |
|---|---|---|
| Monotonic time | Timestamps going backwards | Re-sort only if the cause is known; otherwise flag the file |
| Duplicates | Identical rows (same time, bid, ask) | Remove exact duplicates; keep repeated prices with different times |
| Crossed or zero spread | Ask ≤ bid | Remove; frequent cases point to a broken source or merged feeds |
| Abnormal spread | Spread above, say, 10× the hourly median outside known events | Flag; keep if it matches rollover or news, remove if isolated |
| Price spikes | A mid jump of many times the recent volatility that reverses within a few ticks | Remove isolated spikes; never filter real news moves |
| Gaps | No ticks for more than 60 seconds in liquid hours | Map the gaps; exclude those periods from the test or mark trades inside them |
| Stale quotes | The same bid/ask repeated for minutes while other sources move | Treat as a gap |
| Weekend and holiday ticks | Quotes between the Friday close and the Sunday open | Remove, or check the time zone if a whole hour appears there |
| Tick density | Ticks per hour compared with the same hour on other days | A sudden drop suggests throttling or a recording problem |
| Price scale and digits | 4-digit vs 5-digit quotes, JPY pairs with 3 decimals | Normalize before merging sources |
A simple, robust spike rule: compute the rolling median absolute deviation (MAD) of mid-price changes over the last 200 ticks; flag any tick whose change exceeds about 15× the MAD and is mostly reversed within the next three ticks. A real news move does not reverse in three ticks; a bad print usually does. Tune the thresholds per pair and look at what you remove, because an over-eager filter deletes exactly the moves an arbitrage or news strategy needs.
Step by step: preparing tick data for a backtest
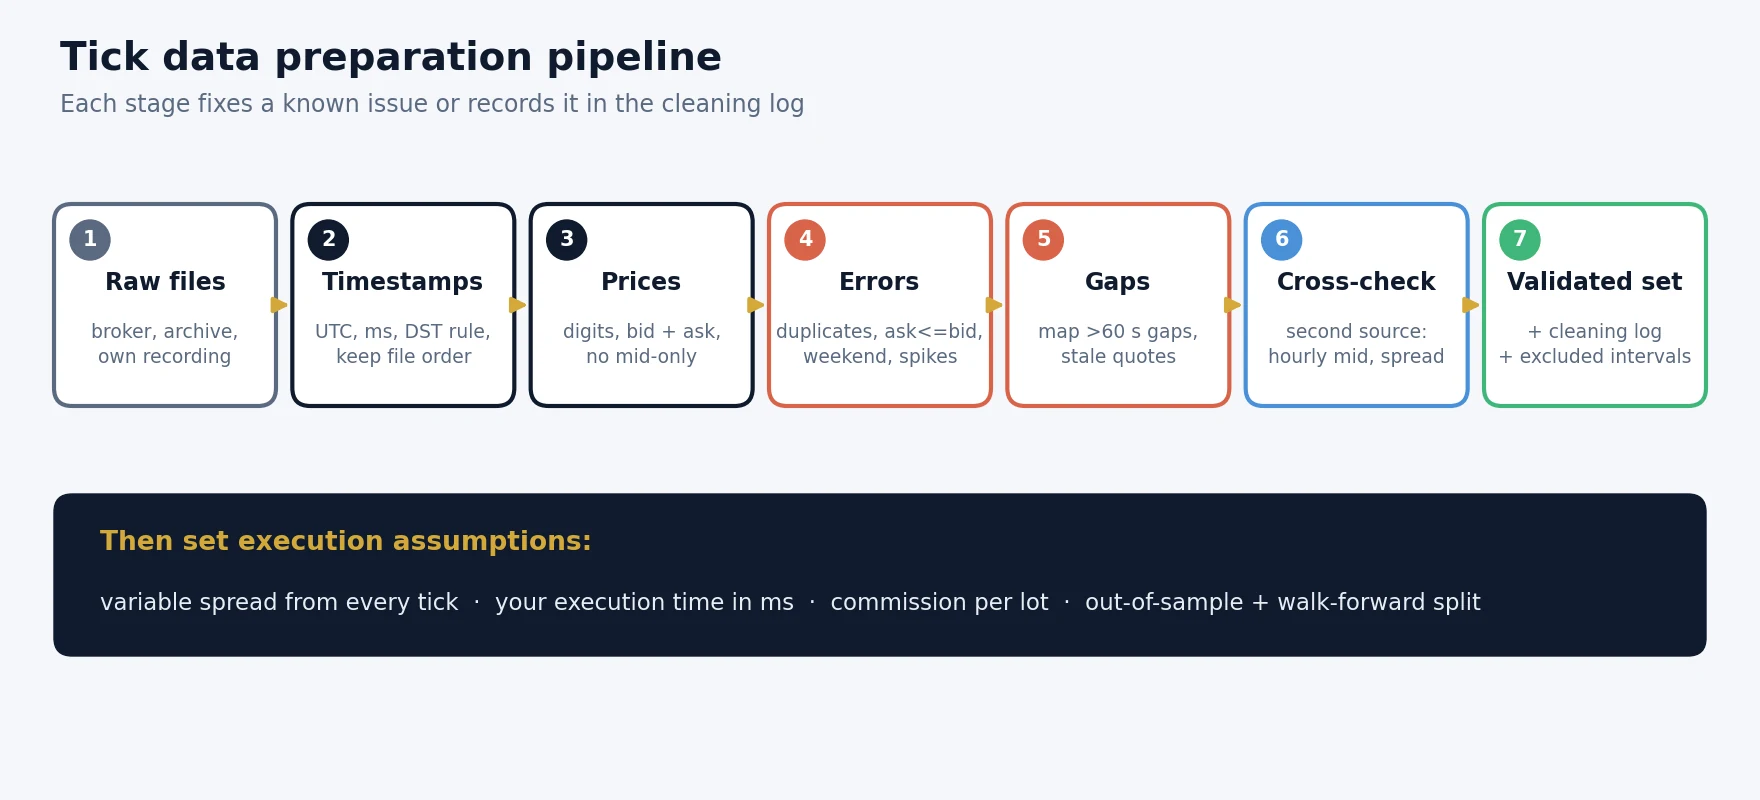
1
2
3
4
5
6
7
8
Variable spread: the cost a fixed spread hides
Many tests use a single spread value, for example 0.8 pips for EUR/USD. Real spreads move all day: tight in the London and New York overlap, wider in the Asian session, several pips wide for a few minutes around the daily rollover and around major releases. The causes are covered in our guide to why forex spreads widen.
A fixed spread is wrong in a systematic way, because strategies do not trade at random times. A breakout strategy tends to fire when volatility rises, which is exactly when spreads widen. A mean-reversion strategy that trades the quiet Asian session meets spreads above the daily average. With recorded bid/ask ticks, each trade pays the spread that was actually quoted at that moment.
Worked example (illustrative numbers). A scalping strategy makes 400 round trips a month on EUR/USD with 1 standard lot (about $10 per pip).
The 1.1-pip figure is an example to show the mechanism, not a measured value for any broker. Measure the average spread your strategy’s trades actually meet in the tick data.
How much the data assumption changes the result
To show the effect of each assumption, the chart below takes one hypothetical short-term strategy and changes only the data and execution model. The numbers are illustrative, built to reflect the direction and rough size of effects we routinely see when moving from bar-based tests to tick-based tests with realistic execution. They are not the results of a specific strategy.
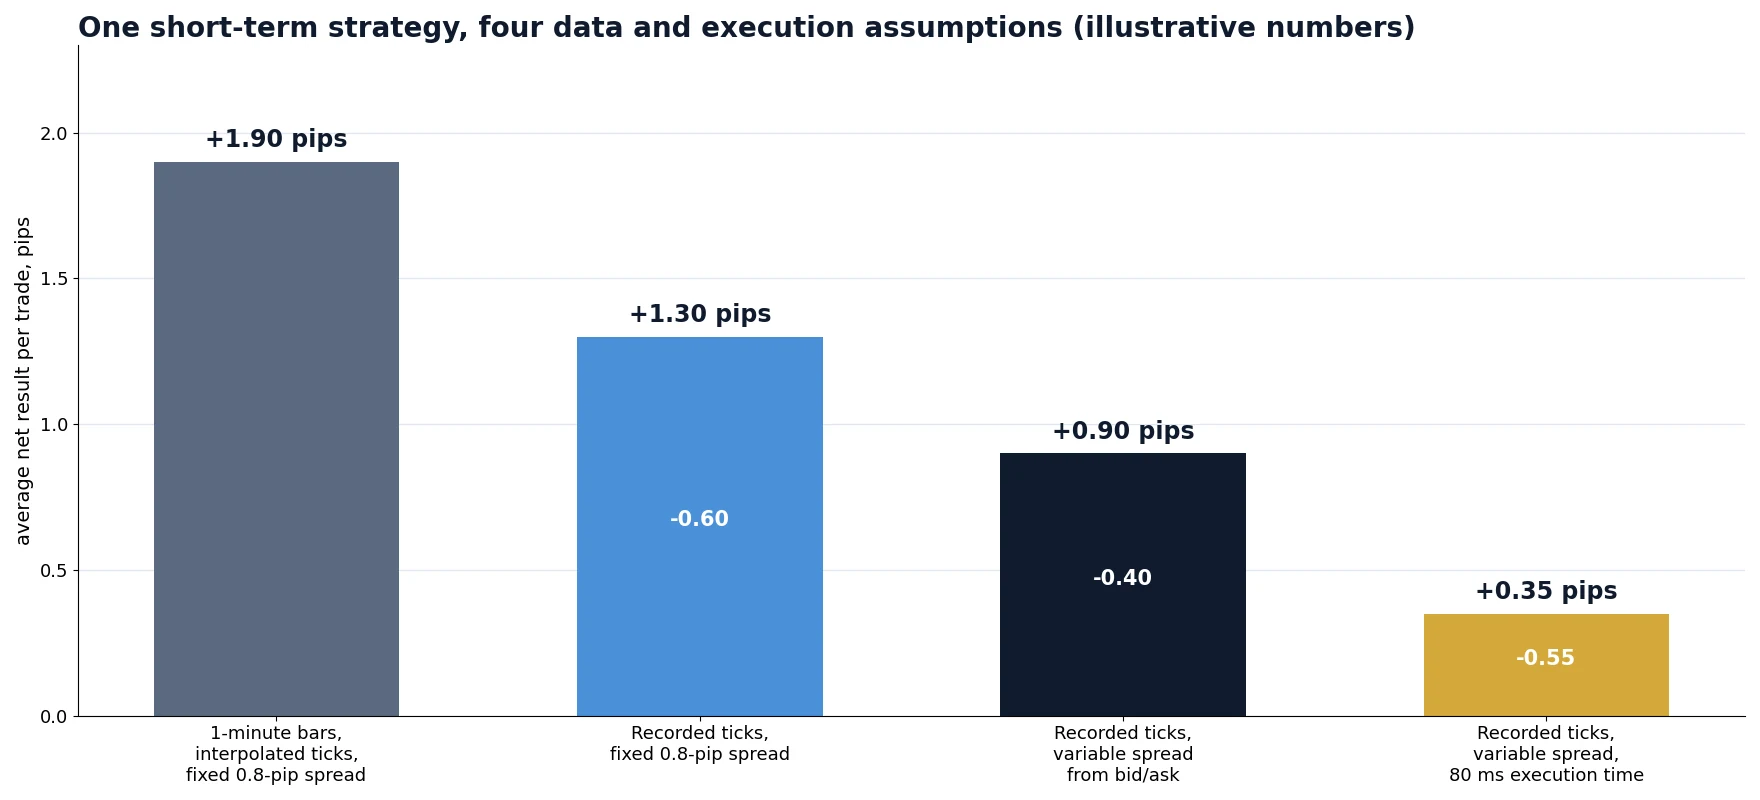
The pattern is what matters. Each realistic assumption removes some of the edge, and the last step, execution time, often removes the most for short-term strategies. If a strategy survives all four steps with a positive result and a sensible number of trades, it is worth a small live test. If it only looks good in the first column, the edge belongs to the data model, not the market.
Ticks are necessary, not sufficient: execution time
Even a perfect tick dataset gives an optimistic test if every order fills at the price of the tick that triggered it. Live, there is always a delay between the decision and the fill: your platform, the network, the broker’s processing. During that delay the market moves on. On a quiet day the effect is a fraction of a pip; on a fast move it is the difference between a winning and a losing trade.
The correct model walks forward through the tick stream by the request part of your execution time and fills at the bid or ask that was quoted at that later moment. That produces realistic slippage, positive and negative, without guessing a slippage number. We explain this model, the four latency components and a worked example in the article on the execution time gap in latency arbitrage backtests, and how to measure slippage on live fills in forex slippage explained.
This is also the most common answer to the question “why do my live results differ from the backtest?” The data was fine; the fill model assumed zero delay. A good rule of thumb is to test at your measured execution time and again at 1.5 to 2 times that value. A strategy that collapses at the higher value is fragile.
Storage, formats and handling
Tick data is large, and the format you choose affects both disk space and how fast an optimizer can replay it. A rough estimate for one active major pair:
Order-of-magnitude estimates. Compressed columnar formats usually shrink tick files several times further.
- Store prices as integers in points (1.08512 → 108512). It avoids floating-point rounding when you compare prices and halves the size.
- Partition by symbol and day. One file per symbol per day makes gap checks, partial reloads and parallel optimization simple.
- Keep the raw files untouched. Clean into a separate dataset and keep the cleaning log, so you can reproduce any result.
- Keep CSV for exchange. A plain format with timestamp, bid and ask is what most tools import. SharpTrader Optimizer, for example, accepts your own tick data as CSV with timestamp, bid and ask.
Common pitfalls
- Calling interpolated bars “tick data”. Check whether your tool replays recorded quotes or generates them from bars.
- Testing on mid prices. A mid-only dataset ignores the spread entirely; costs must come from the bid and the ask.
- Mixing sources in one test. Joining two vendors’ files creates artificial jumps at the seam and different spread regimes in one period.
- Ignoring the time zone and DST. Session filters and daily rollover logic shift silently.
- Filling gaps with invented prices. A strategy can “trade” during an outage that never had real quotes. Exclude gaps instead.
- Over-cleaning. Deleting every large move removes the news spikes and jumps that some strategies are built to trade.
- Zero-latency fills. Perfect fills at the signal tick make almost any short-term strategy look profitable.
- Optimizing on all the data. Without an out-of-sample period and walk-forward checks, a large parameter grid will find a curve that fits the past and nothing else.
Tick data in SharpTrader Optimizer
We built SharpTrader Optimizer around the points in this guide. It replays real historical bid/ask ticks instead of interpolated bars, takes the spread from every tick, and lets you set your order execution time in milliseconds so that each fill comes from the tick stream after that delay. You can use BJF Feed tick history recorded on London, Tokyo and New York nodes, or import your own broker’s ticks as CSV. Parameter grids run on all CPU cores, which matters when one year of one pair is tens of millions of ticks.
If you already have a strategy of your own, the article on testing your own bot in SharpTrader shows the complete workflow from code to tick-level optimization.
Test on the ticks your strategy will really meet
Real bid/ask ticks, variable spread on every quote and your broker’s execution time in milliseconds: the three inputs that decide whether a short-term strategy survives live trading.
Free arbitrage scanner + short email course
Get the free scanner link and a few short, practical emails from Boris: what a price gap really means after costs, how to test a strategy before risking real money, and which tools fit your market. No hype.
FAQ
What is forex tick data?
Forex tick data is a record of every quote change in a currency pair, with a timestamp, the bid price, the ask price and sometimes the quoted volume. It keeps the exact order, timing and spread of price updates, which bar data loses.
Where can I get free forex tick data?
Some ECN brokers and aggregators publish free historical bid/ask ticks for major pairs, and many brokers let you download their own history. Free archives are useful for research, but they show one venue’s prices, so confirm the final result on your own broker’s recorded ticks.
Is tick data better than 1-minute data for backtesting?
For strategies with targets and stops within a few pips, scalping, news trading and arbitrage, yes: one-minute bars hide the order of the high and low, price jumps and the real spread. For swing strategies with wide stops, clean one-minute data with a realistic spread is often enough.
Why do I get different backtest results on two data sources?
Spot forex has no central tape, so every source is a different venue’s view. Spreads, quote frequency, time zones, daylight-saving handling and cleaning rules all differ. Compare hourly prices and spreads between the two datasets to find the cause, and trust the source closest to your execution venue.
How much storage does a year of forex tick data need?
For one active major pair, roughly tens of millions of ticks a year: about 2 GB as CSV text or around 0.6 GB in a compact binary format before compression. Several pairs over several years quickly reach tens of gigabytes.
Why does my tick-data backtest show perfect fills?
Because the test fills each order at the tick that generated the signal. Real orders take time to reach the broker, and the price moves in between. Model execution time by walking forward in the tick stream and filling at the later bid or ask, and test at 1.5 to 2 times your measured delay.
Do I need both bid and ask, or is the mid price enough?
You need both. Buys fill at the ask and sells at the bid, so the spread is a real cost on every trade. A mid-only dataset removes that cost and makes short-term strategies look better than they are.
This article is educational and does not constitute financial advice. Examples, charts and figures marked as illustrative are not measurements of any specific broker or strategy; data sources, conventions and costs differ between providers and change over time.
