Live Test of the New Parameters: LockCL2 and Phantom Drift on Real Accounts Friday October 30th, 2026 – Posted in: Arbitrage Software, Forex trading
Live Test of the New Parameters: LockCL2 and Phantom Drift on Real Accounts
We ran LockCL2 side by side with and without the new entry and exit parameters, added Phantom Drift with the new parameters, and put all six live accounts on public monitoring. Here are the settings, the first week of results, the charts, and an honest look at what one week can and cannot prove.
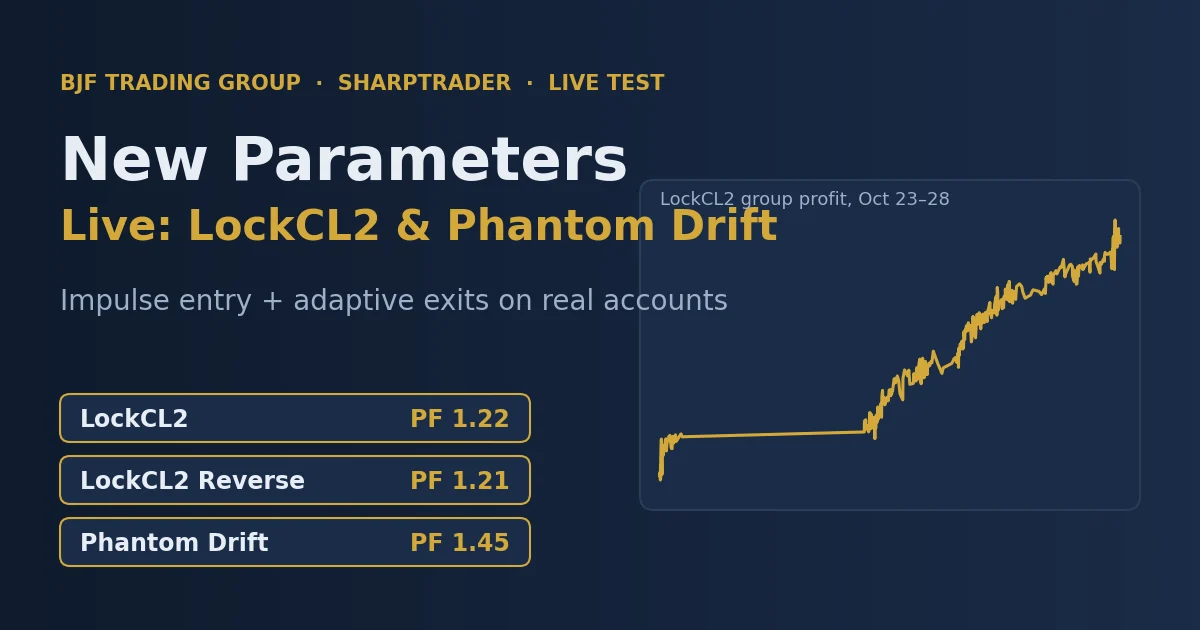
Short answer: in the first live week (October 23–30, 2026) all three monitored groups closed in profit. The LockCL2 pair with the new parameters (the group named LockCL2 Reverse) earned $17,673.40, against $16,808.57 for the same strategy without them, over the same days and with almost the same deposit: about 5% more profit from 43% more trades, with the same profit factor (1.21 vs 1.22) and a slightly lower drawdown in percent (10.76% vs 11.30%). Phantom Drift with the new parameters earned $15,161.15 with a profit factor of 1.45. That is a good start, not proof: it is one week, mostly gold, and the individual accounts of each lock pair had much deeper drawdowns than the group. The monitoring stays public, so you can follow the results as they grow.
Watch the test in 5 minutes: the settings, the two LockCL2 pairs side by side and Phantom Drift live.
In this article
- What we changed
- How the test is set up
- Results at a glance
- LockCL2: the baseline without the new parameters
- LockCL2 Reverse: the same strategy with the new parameters
- Head to head: with and without the new parameters
- Phantom Drift
- Why we judge the group, not each account
- What one week can and cannot tell us
- How to run the same test on your accounts
- FAQ
What we changed
SharpTrader recently received two groups of per-instrument parameters. The first decides when a trade opens and when it is closed early; the second decides how each trade is exited, based on how strong its signal was and how well it was filled. Both groups are off by default (value 0). In this test we ran two LockCL2 pairs in parallel: one with the new parameters switched on (the group named LockCL2 Reverse, after Reverse factor %) and one with all of them at 0 as a baseline. Phantom Drift ran with the new parameters. Everything else was left as it was.
| Parameter | What it does | Test value |
|---|---|---|
| Min move | Entry on a fast-feed impulse: the fast feed must move at least this much within Trend interval. | 25 points on FX, 50 on XAUUSD |
| Trend interval (ms) | Time window in which the impulse must happen. | 100 ms |
| Cooldown (ms) | Minimum time between two impulse signals on the same symbol. | 0 |
| Reverse factor % | Closes a position early when the fast/slow difference turns against it. | 20% on XAUUSD only, 0 elsewhere |
| Diff excess factor % | Gives trades opened on a strong signal more room: raises Min profit and Trailing step. | 50% |
| Slippage factor % | Locks profit sooner after a bad fill: lowers Min profit and Trailing step. | 50% |
| Critical slippage % | Puts a tight, spread-based stop on a trade whose gap was eaten by slippage. | 80% |
How each parameter works, with formulas and worked examples, is explained in two separate guides: impulse entry and reverse exit (Min move, Trend interval, Cooldown, Reverse factor %) and adaptive exits for arbitrage trades (Diff excess factor %, Slippage factor %, Critical slippage %).
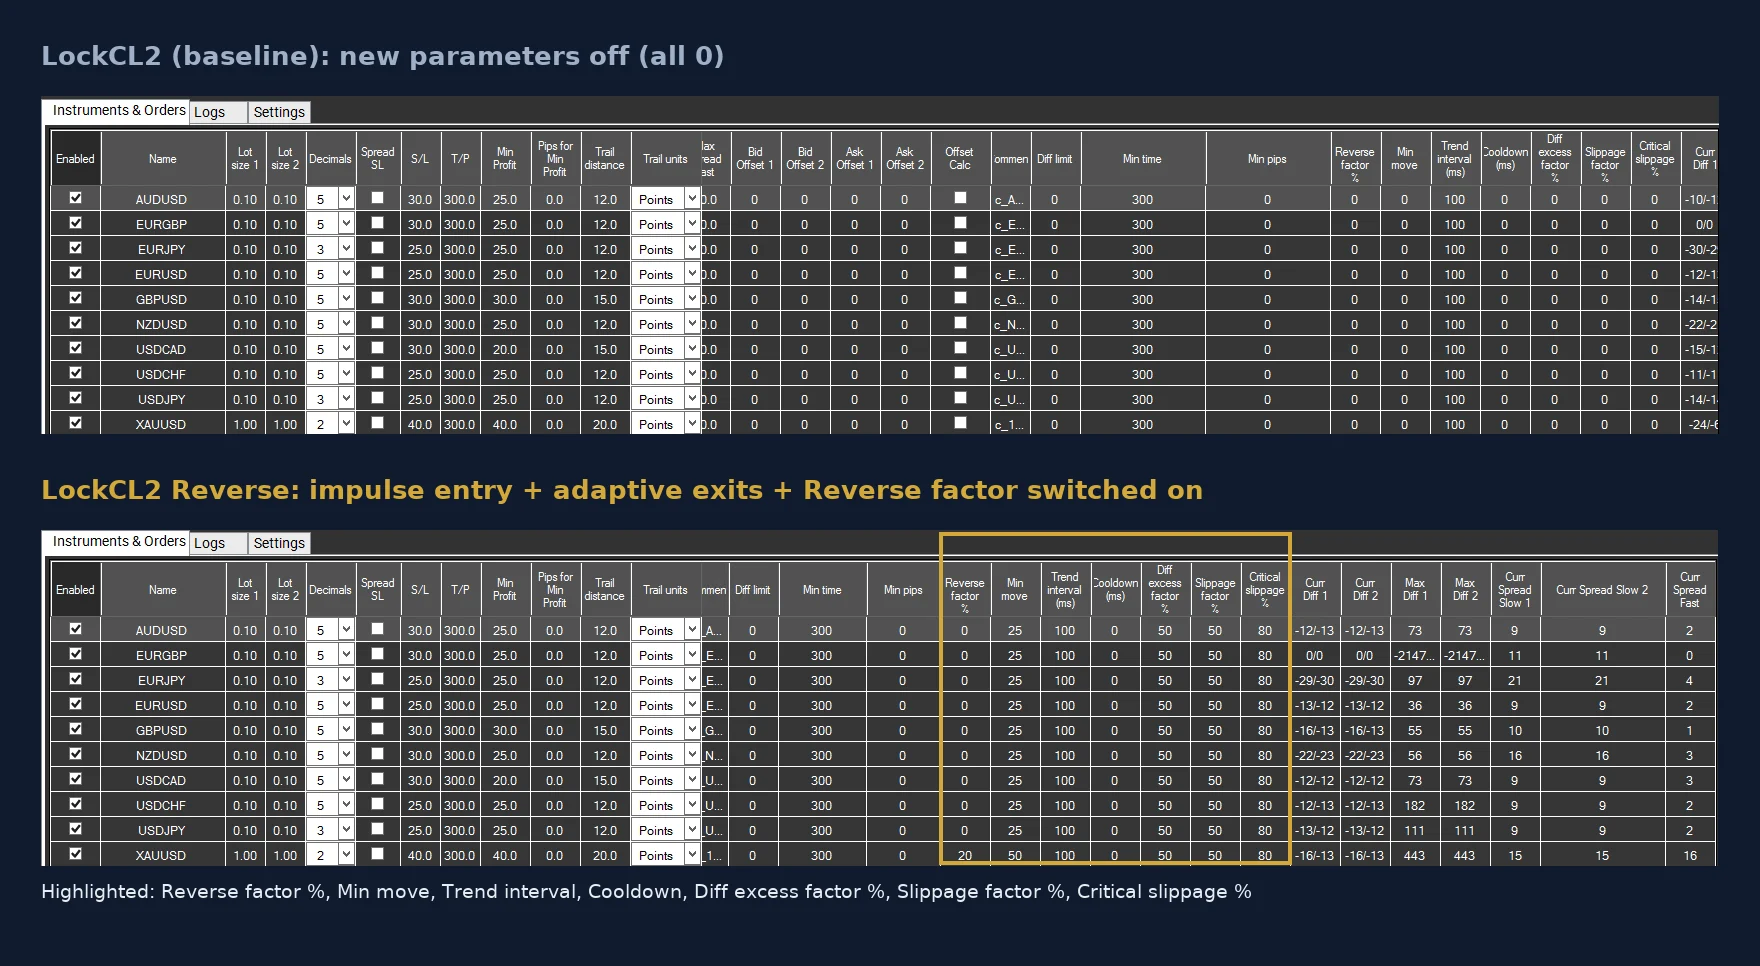
A few details are worth noting. Min move is set above the slow broker’s usual spread (25 points on FX, 50 on gold), as the guide recommends, so an impulse is always bigger than the cost of crossing the spread. Reverse factor % is used only on XAUUSD, the instrument with the largest and fastest reversals. Critical slippage is set at 80%: the tight stop fires only when slippage has taken more than four fifths of the signal’s difference.
How the test is set up
- Three groups, six live accounts. Each group is a lock pair: two live USD accounts at two brokers that hold opposite positions, as lock arbitrage requires.
- Strategies: LockCL2 as the baseline with the new parameters off; LockCL2 Reverse, the same strategy with the new parameters on (the name comes from Reverse factor %); and Phantom Drift with the new parameters, which uses LockCL2 for its lock phase.
- Start date: October 23, 2026. Results below are a snapshot of October 30, 2026.
- Public monitoring. All accounts are connected to Strategy X-Ray, a new account-statistics service, with read-only access. The group pages are public, so the numbers in this article can be checked and followed live.
- Position size: 0.10 lot on currency pairs and 1.00 lot on XAUUSD, which is aggressive for the deposit size. That is why the percentage gains are large, and why the drawdowns of single accounts are large too.
Results at a glance
| LockCL2 | LockCL2 Reverse | Phantom Drift | |
|---|---|---|---|
| New parameters | Off (baseline) | On | On |
| Period | Oct 23–28 | Oct 23–28 | Oct 23–30 |
| Net profit | $16,808.57 | $17,673.40 | $15,161.15 |
| Gain | +86.82% | +91.05% | +38.56% |
| Max drawdown (group) | 11.30% ($2,481.00) | 10.76% ($3,178.00) | 12.20% ($6,351.41) |
| Profit factor | 1.22 | 1.21 | 1.45 |
| Trades | 388 | 555 | 201 |
| Win rate | 52.8% | 52.1% | 58.7% |
| Daily correlation of the two accounts | −0.66 | −0.78 | 0.29 |
| Live monitoring | open | open | open |
A profit factor of about 1.2 with a win rate just above 50% is typical of lock arbitrage: many small closes on both sides, with the edge coming from the size of winning closes rather than from how often they win. Phantom Drift trades less often and holds positions longer, so it shows fewer trades and a higher profit factor.
LockCL2: the baseline without the new parameters
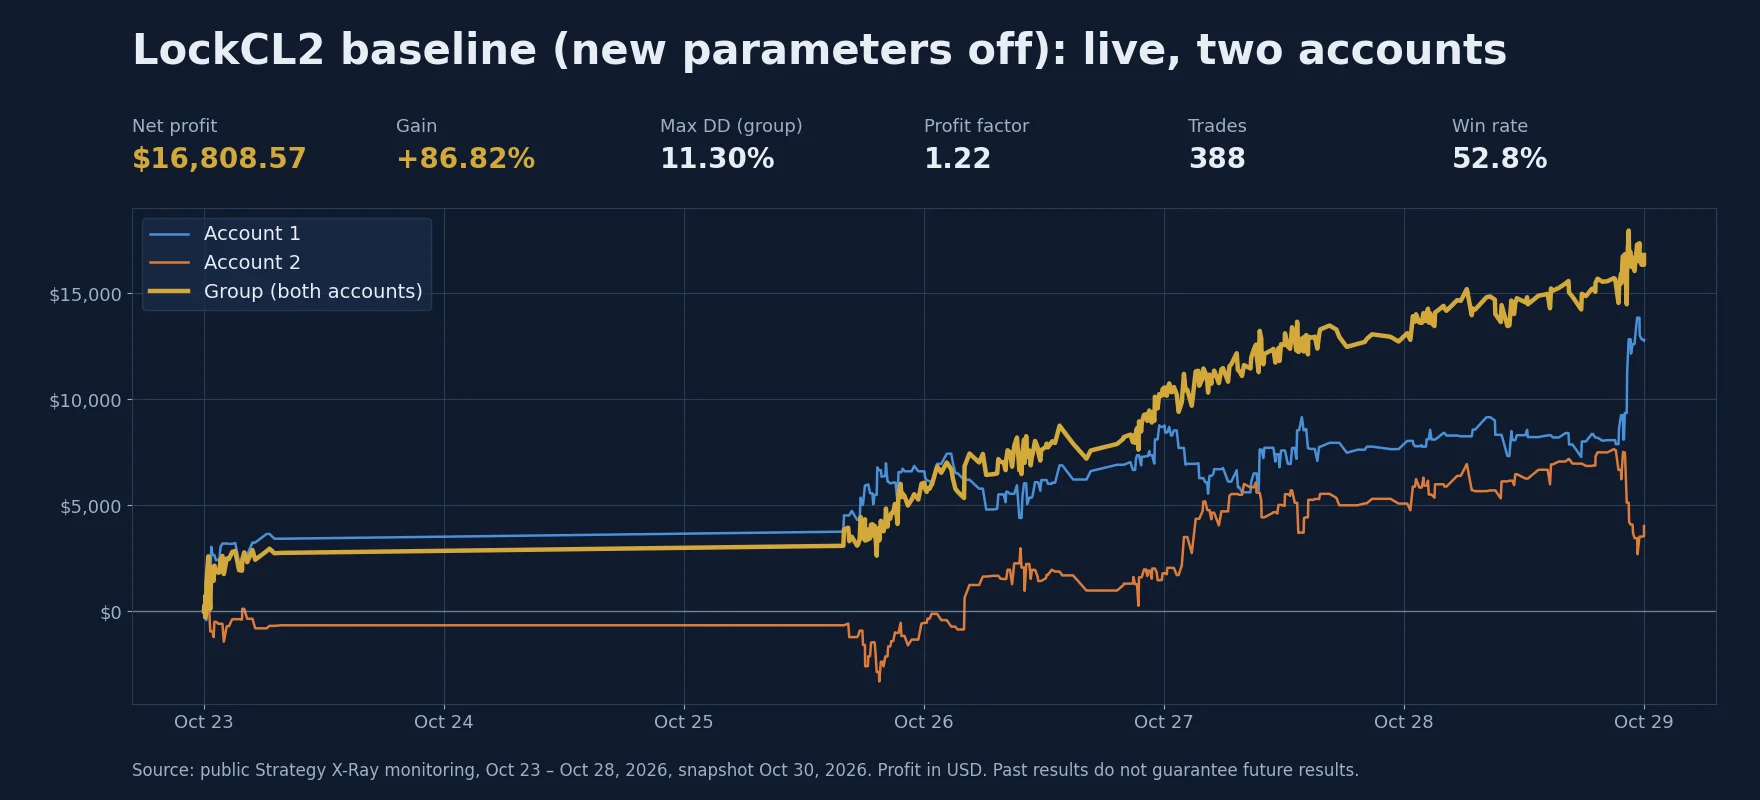
| Account | Net profit | Gain | Max drawdown | Trades |
|---|---|---|---|---|
| Account 1 | $12,788.37 | +130.49% | 17.59% | 194 |
| Account 2 | $4,020.20 | +42.05% | 43.65% | 194 |
| Group | $16,808.57 | +86.82% | 11.30% | 388 |
This pair runs LockCL2 with all the new parameters at 0, as a baseline for the comparison. The two accounts mirror each other, which is what a lock pair should do: their daily results have a correlation of −0.66. When one account dips, the other rises, so the group curve is much smoother than either account. The flat stretch on the chart is the weekend. Most of the profit comes from XAUUSD; the currency pairs trade at 0.10 lot and add smaller amounts. At the snapshot the group had no open positions.
LockCL2 Reverse: the same strategy with the new parameters
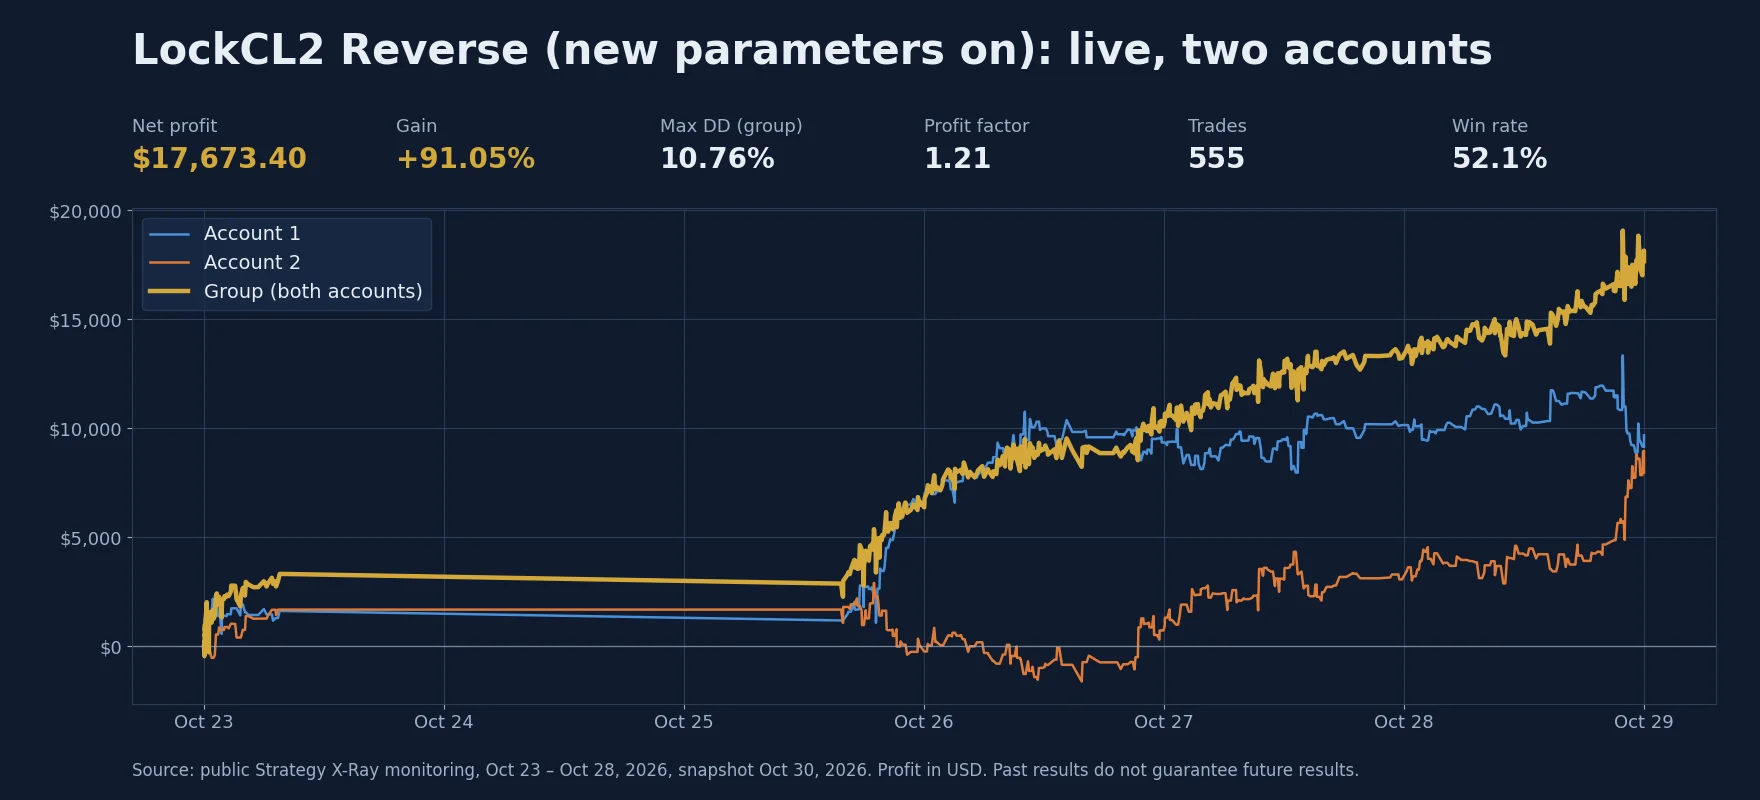
| Account | Net profit | Gain | Max drawdown | Trades |
|---|---|---|---|---|
| Account 1 | $9,697.19 | +99.56% | 19.28% | 277 |
| Account 2 | $7,976.21 | +82.48% | 35.91% | 278 |
| Group | $17,673.40 | +91.05% | 10.76% | 555 |
The second LockCL2 pair runs the same instruments at the same lot sizes, with Min move, Trend interval, the three adaptive exits and Reverse factor % (20% on XAUUSD) switched on; the group is named after Reverse factor %. It traded more often (555 trades against 388), split profit more evenly between the two accounts and had the strongest hedge of the three groups: a daily correlation of −0.78. At the snapshot one XAUUSD lock was open: a buy on Account 1 and a sell on Account 2 at almost the same price. Each leg shows a large floating result on its own (about −$16,961 and +$16,950), but together they net to roughly −$12, which is exactly how a lock is supposed to look while it waits for its unlock signal.
Head to head: with and without the new parameters
Both LockCL2 pairs started with almost the same deposit (about $19,400 each, judging by profit and gain), traded the same instruments at the same lot sizes and ran over the same days. That makes them a fair side-by-side comparison.
| Oct 23–28, 2026 | LockCL2 (baseline) | LockCL2 Reverse (new parameters) | Difference |
|---|---|---|---|
| Net profit | $16,808.57 | $17,673.40 | +$864.83 (+5.1%) |
| Gain | +86.82% | +91.05% | +4.23 percentage points |
| Trades | 388 | 555 | +167 (+43%) |
| Average profit per trade | $43.32 | $31.84 | −$11.48 |
| Profit factor | 1.22 | 1.21 | practically the same |
| Win rate | 52.8% | 52.1% | practically the same |
| Max drawdown (group) | 11.30% ($2,481.00) | 10.76% ($3,178.00) | −0.54 points in %, +$697 in dollars |
| Daily correlation of the two accounts | −0.66 | −0.78 | stronger hedge |
With the new parameters the strategy took 43% more trades and earned about 5% more. The extra trades most likely come from impulse entries (Min move), which add signals the classic Diff to open entry does not take. Each of them earns less on average, so profit per trade fell from $43 to $32 while the total grew. Profit factor and win rate stayed practically the same, so the new exits did not make losing trades more frequent, and the drawdown was slightly lower in percent and somewhat higher in dollars.
Over one week these differences are small and within what chance alone can produce. The clear result so far is narrower: the new parameters did not hurt, kept the quality of the trades and added trading volume. Whether they add a lasting edge will only show over months.
Phantom Drift
| Account | Net profit | Gain | Max drawdown | Trades |
|---|---|---|---|---|
| Account 1 | $6,354.63 | +32.49% | 22.00% | 104 |
| Account 2 | $8,806.52 | +44.57% | 28.53% | 97 |
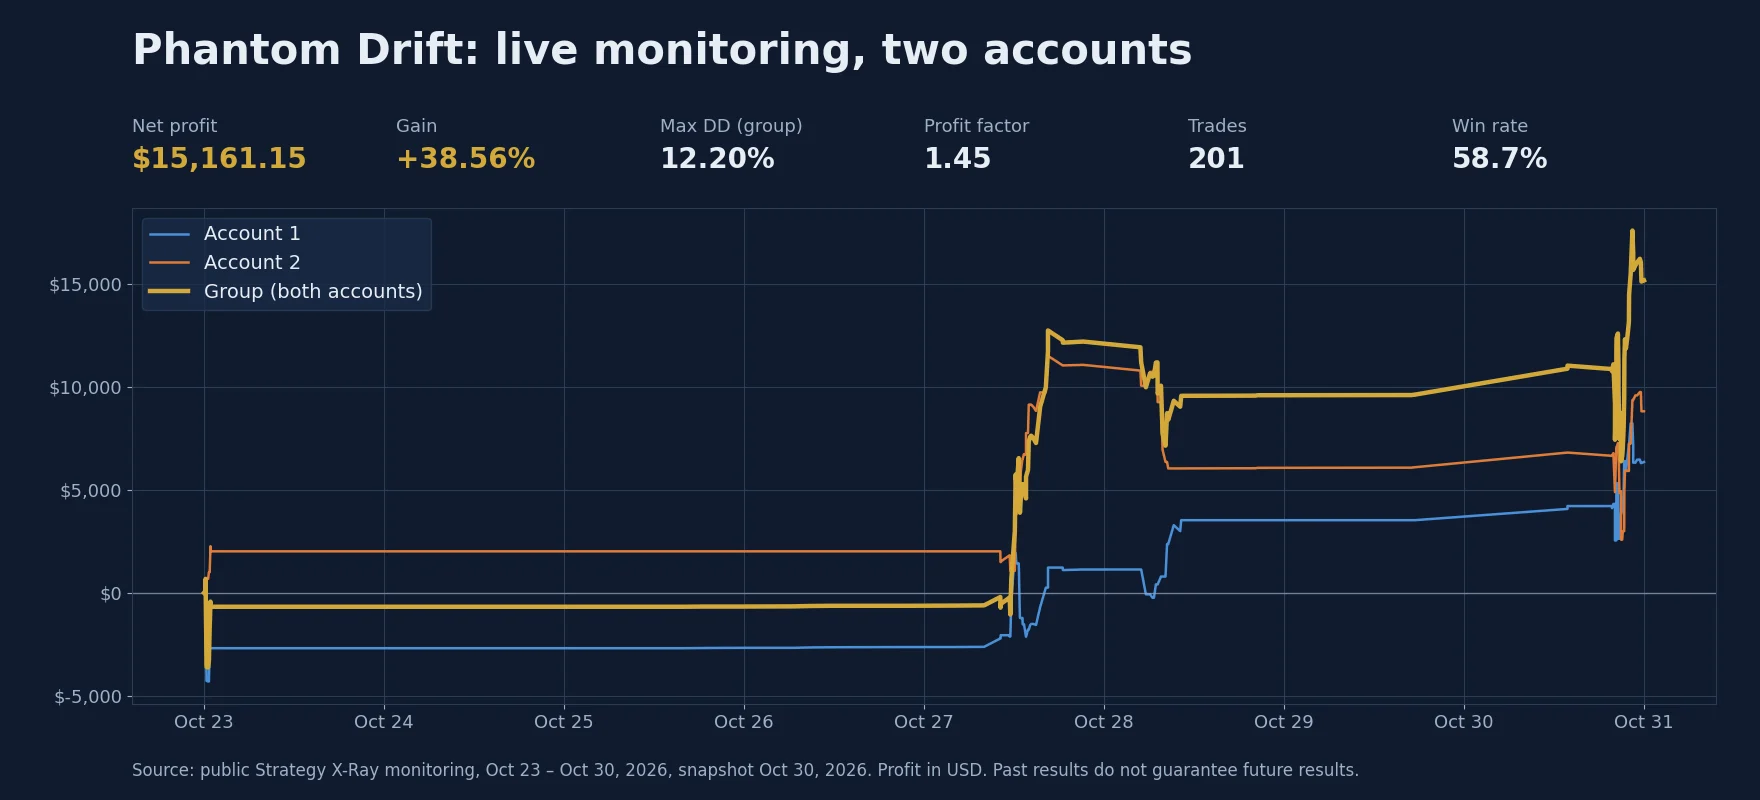
| Group | $15,161.15 | +38.56% | 12.20% | 201 |
Phantom Drift works differently from a pure lock. It enters on an RSI signal, adds to the position when the price moves against it, and switches to the LockCL2 lock phase when the drawdown reaches the configured depth; the arbitrage exit comes later, from the fast feed. The new exit parameters act only on the arbitrage position, while averaging orders keep their own settings. That explains the different numbers: fewer trades (201), longer holding times, the highest profit factor of the three (1.45) and a daily correlation of only 0.29 between the accounts, which means the two accounts are more independent than in a pure lock. At the snapshot seven positions were open (XAUUSD and EURUSD), so part of the result was still floating. For a longer history of this strategy, see our year-one Phantom Drift write-up.
Why we judge the group, not each account
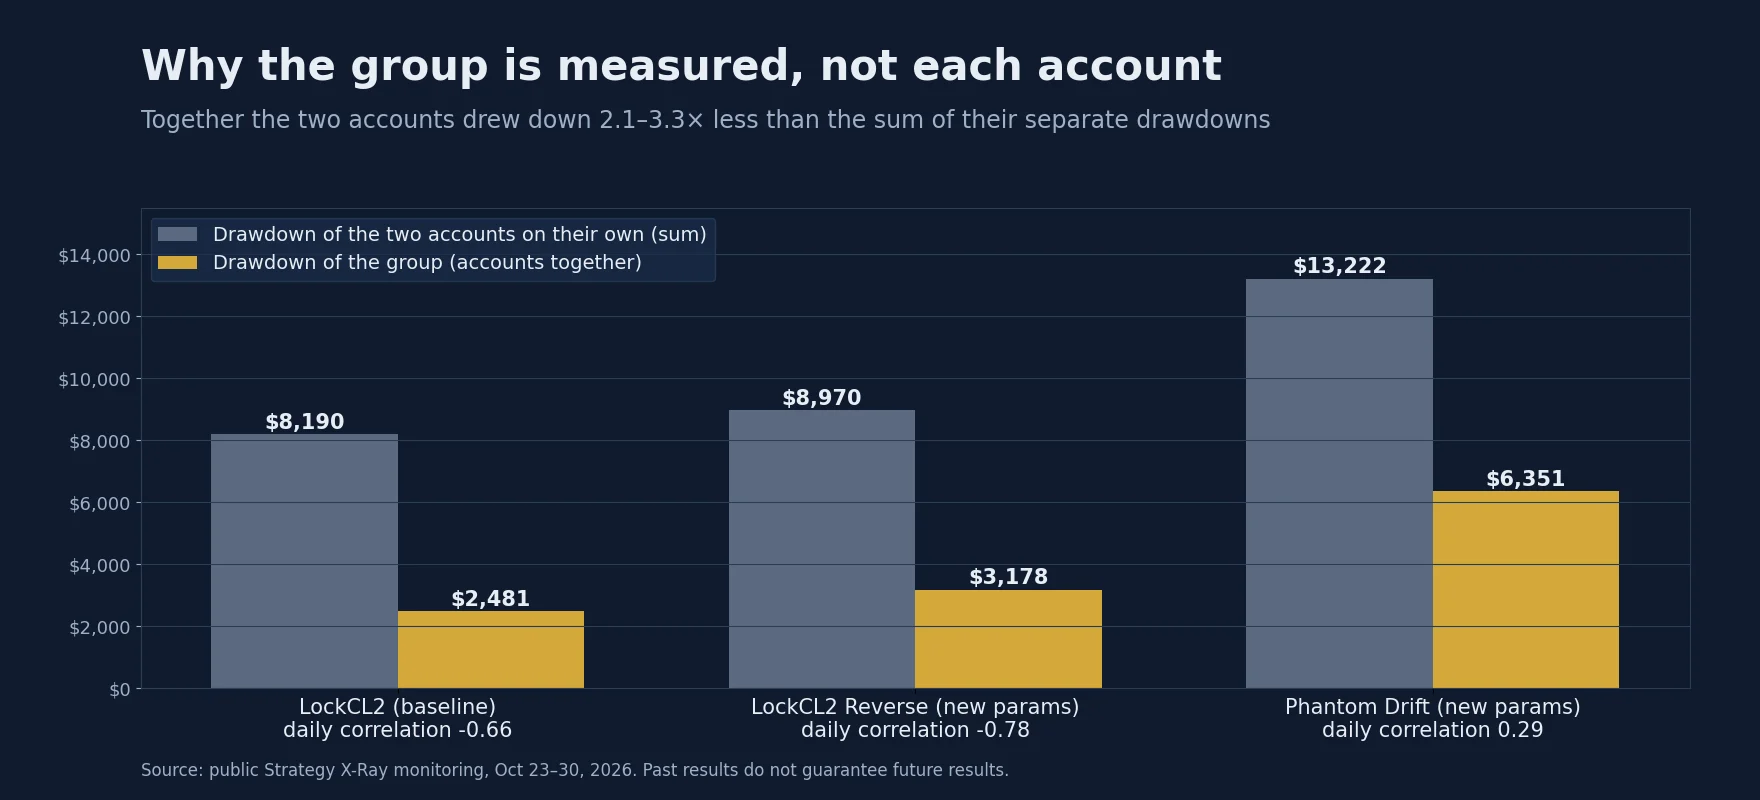
In a lock strategy one account is often deep in the red while the other is in profit. Looking at a single account gives a misleading picture: Account 2 of LockCL2 had a 43.65% drawdown on its own, yet the group never fell more than 11.30%. What matters for the trader is the combined equity of both accounts.
The other side of this is important: each account must be funded well enough to survive its own drawdown. If one account of the pair hits a margin call, the lock breaks and the group is no longer hedged. That is why we read the per-account drawdowns as a sizing requirement, not as noise.
What one week can and cannot tell us
We publish these results because they are real and public, but they need context.
- It is a short period. Five to six trading days, with a weekend in between. A week can be lucky or unlucky; meaningful conclusions need months.
- It is a side-by-side test, not a lab experiment. The baseline and the new-parameter pair ran on different accounts, so differences in fills between them also affect the result, and we see the combined effect of all the new parameters, not the contribution of each one. Phantom Drift has no baseline pair in this test.
- Gold dominates. XAUUSD trades at 1.00 lot and produces most of the profit and most of the risk. A quiet or a very one-sided gold market will change the picture.
- Position size is aggressive. The gains in percent are large because the lots are large for the deposit. Single-account drawdowns of 17–44% show the other side of that.
- Brokers react. Arbitrage results depend on the broker pair, execution speed and how long the brokers tolerate the trading. Your results on other brokers will differ.
What the week does show: the new entry and exit logic runs live without problems on two strategies, the LockCL2 pair with the new parameters did at least as well as the baseline, all three groups closed the week in profit, the hedge between accounts works as designed, and the results can be followed independently on the public monitoring pages. We will update the numbers as the test continues.
How to run the same test on your accounts
1
2
3
4
5
Our 10-minute video shows how to build and stress-test your own LockCL2 template step by step: build your own set file in SharpTrader. More background on tuning these strategies is in optimizing Phantom Drift and lock strategies.
Try the new parameters in SharpTrader
Min move, Reverse factor % and the adaptive exits are available in LockCL2, the other Lock strategies and Phantom Drift, in live trading, emulator mode, backtesting and optimization.
Free arbitrage scanner + short email course
Get the free scanner link and a few short, practical emails from Boris: what a price gap really means after costs, how to test a strategy before risking real money, and which tools fit your market. No hype.
FAQ
Are these results from live or demo accounts?
Live. All six accounts are marked as live USD accounts on the public Strategy X-Ray monitoring pages linked in the results table.
Why does one account of a pair sometimes lose a lot?
In lock arbitrage the two accounts hold opposite positions. When the price moves, one leg gains and the other loses; profit comes from closing the legs at the right moments. The group result is what counts, but each account must be funded to survive its own drawdown.
What is the difference between LockCL2 and LockCL2 Reverse here?
LockCL2 is the baseline: all new parameters are at 0. LockCL2 Reverse runs the same strategy with the new parameters switched on (Min move, Trend interval, Diff excess factor %, Slippage factor %, Critical slippage % and Reverse factor % on XAUUSD); the name comes from Reverse factor %. In the first week it took 43% more trades and earned about 5% more with the same profit factor.
Can I use the same settings on my brokers?
You can start from them, but do not copy them blindly. Spreads, execution time and price behaviour differ between broker pairs. Optimize the parameters on ticks recorded from your own fast feed and brokers.
Do the new parameters work in other strategies?
Yes. Min move and Reverse factor % were introduced in OneLeg, and the adaptive exits are available in OneLeg, Lock, LockCL, LockCL2, LockCL3, Phantom Drift and Umbra Lock. All are off by default.
Will you update these results?
Yes. The monitoring pages update automatically, and we will update this article as the test runs longer.
Trading forex, CFDs and precious metals involves a high level of risk. The results shown cover a short period and do not guarantee future results. Lock strategies require each account to be funded for its own drawdown. BJF Trading Group provides software only and does not give investment advice.
