CEX-DEX Arbitrage Explained: AMM Price Impact, Gas, MEV and Real Costs Monday November 2nd, 2026 – Posted in: Arbitrage Software, cryptoarbitrage software
CEX-DEX Arbitrage Explained: AMM Price Impact, Gas, MEV and the Real Break-Even
When Bitcoin or Ether moves on a big centralized exchange, the price inside a decentralized exchange pool does not move by itself. It stays where the last swap left it until someone trades it back into line. That someone is a CEX-DEX arbitrageur. This guide explains how the trade works, why a 1% price gap is worth far less than 1%, what gas, pool fees and block builders take, and how to calculate the gap you actually need before an opportunity is real.
- What CEX-DEX arbitrage is
- Why DEX prices lag centralized exchanges
- AMM math: price impact and optimal trade size
- Worked example: a 1% gap on an ETH/USDC pool
- The no-trade band: how big the gap must be
- Two legs, no atomicity: execution risk
- MEV, block builders and who wins the race
- Chain choice: Ethereum, rollups and fast chains
- Inventory, rebalancing and bridges
- Step by step: evaluating an opportunity
- Risks and limitations
- CEX-DEX or CEX-CEX: which suits you
- FAQ
What CEX-DEX arbitrage is
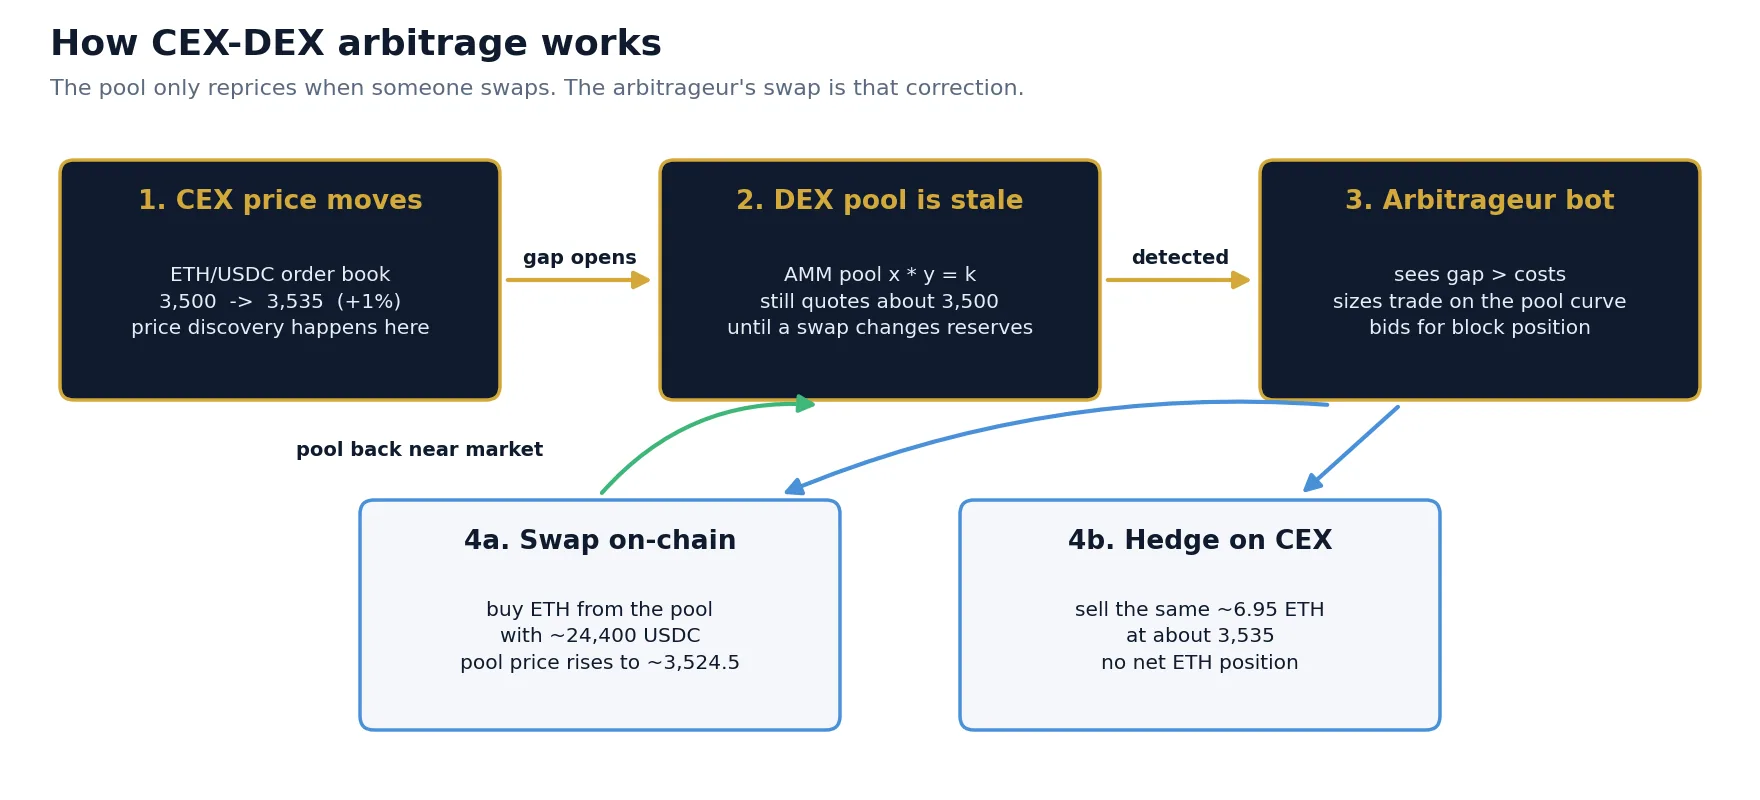
Short answer: CEX-DEX arbitrage is buying a token on a decentralized exchange (a smart-contract pool such as an automated market maker) and selling it on a centralized exchange at the same time, or the reverse, when the two prices differ by more than the total cost of both trades. Because the pool price only changes when someone swaps, it falls behind the centralized market after every move, and arbitrageurs are the ones who pull it back.
The two venues work in completely different ways. A centralized exchange (CEX) runs an order book: market makers post bids and asks, and the price moves continuously as orders arrive, often thousands of times per second. A decentralized exchange (DEX) built on an automated market maker (AMM) has no order book. It holds two reserves of tokens in a smart contract and quotes a price from the ratio of those reserves. The pool does not watch the outside world. If ETH rises 1% on the centralized market, the pool still offers ETH at the old price until a trader buys enough of it to move the reserves.
That trader is usually a bot that does three things almost at once:
- Detects that the pool price is outside the centralized price by more than the costs.
- Swaps on-chain against the pool in the profitable direction, sized so the pool ends up close to the centralized price.
- Hedges on the CEX with the opposite trade, so it holds no net position in the token.
The economics are not a secret: academic work calls the value captured this way loss-versus-rebalancing (LVR), because every dollar the arbitrageur earns is a dollar the pool’s liquidity providers lose compared with rebalancing at market prices. What is less obvious is how little of the visible gap is left after pool fees, price impact, gas and the payment to whoever orders the block. That is what the rest of this guide quantifies. For a broader overview of on-chain arbitrage, flash loans and the MEV supply chain, see our DeFi arbitrage guide; this article focuses on the cross-venue trade and its numbers.
Why DEX prices lag centralized exchanges
Price discovery for large crypto assets happens mostly on the deep centralized spot and perpetual futures markets. Pools follow. Three structural reasons keep them behind:
The pool is passive
An AMM pool has no market maker who cancels stale quotes when news arrives. Its price is a formula of its reserves, and only a swap changes the reserves. Between swaps the pool keeps quoting the old price, however far the market has moved.
Blocks are discrete
A centralized exchange updates continuously; a blockchain updates in steps. On Ethereum mainnet a block comes every 12 seconds, so the pool price can only be corrected once per block, and whoever is placed first in that block takes the correction. Faster chains and rollups produce blocks in hundreds of milliseconds to a couple of seconds, which shrinks the gap that builds up between corrections, but never makes it zero.
Correcting the pool costs money
Each swap pays the pool fee (for example 0.05% or 0.3% of the amount) plus gas. Small deviations are therefore never corrected: it is cheaper to leave them. This creates a band around the centralized price inside which the pool simply drifts. Only when the gap exceeds the band does an arbitrage trade appear.
AMM math: price impact and optimal trade size
You cannot size a CEX-DEX trade the way you size an order-book trade. In a pool, your own trade moves the price, and it moves it along a known curve. That curve decides both how much profit is available and how large the trade should be.
The constant-product formula
The classic AMM (Uniswap v2 style, also used by many forks) keeps the product of the two reserves constant:
Take a pool with x = 2,000 ETH and y = 7,000,000 USDC. The pool price is 7,000,000 / 2,000 = 3,500 USDC per ETH, and k = 14,000,000,000. If you put in Δy USDC (after the fee), you receive
Every USDC you add makes the next ETH more expensive. Buying with 10,000 USDC moves the price far less than buying with 80,000 USDC, and the average price you pay is always worse than the starting pool price. That difference is price impact, and it is not a fee charged by anyone: it is the curve itself.
Optimal size: stop where the pool meets the market
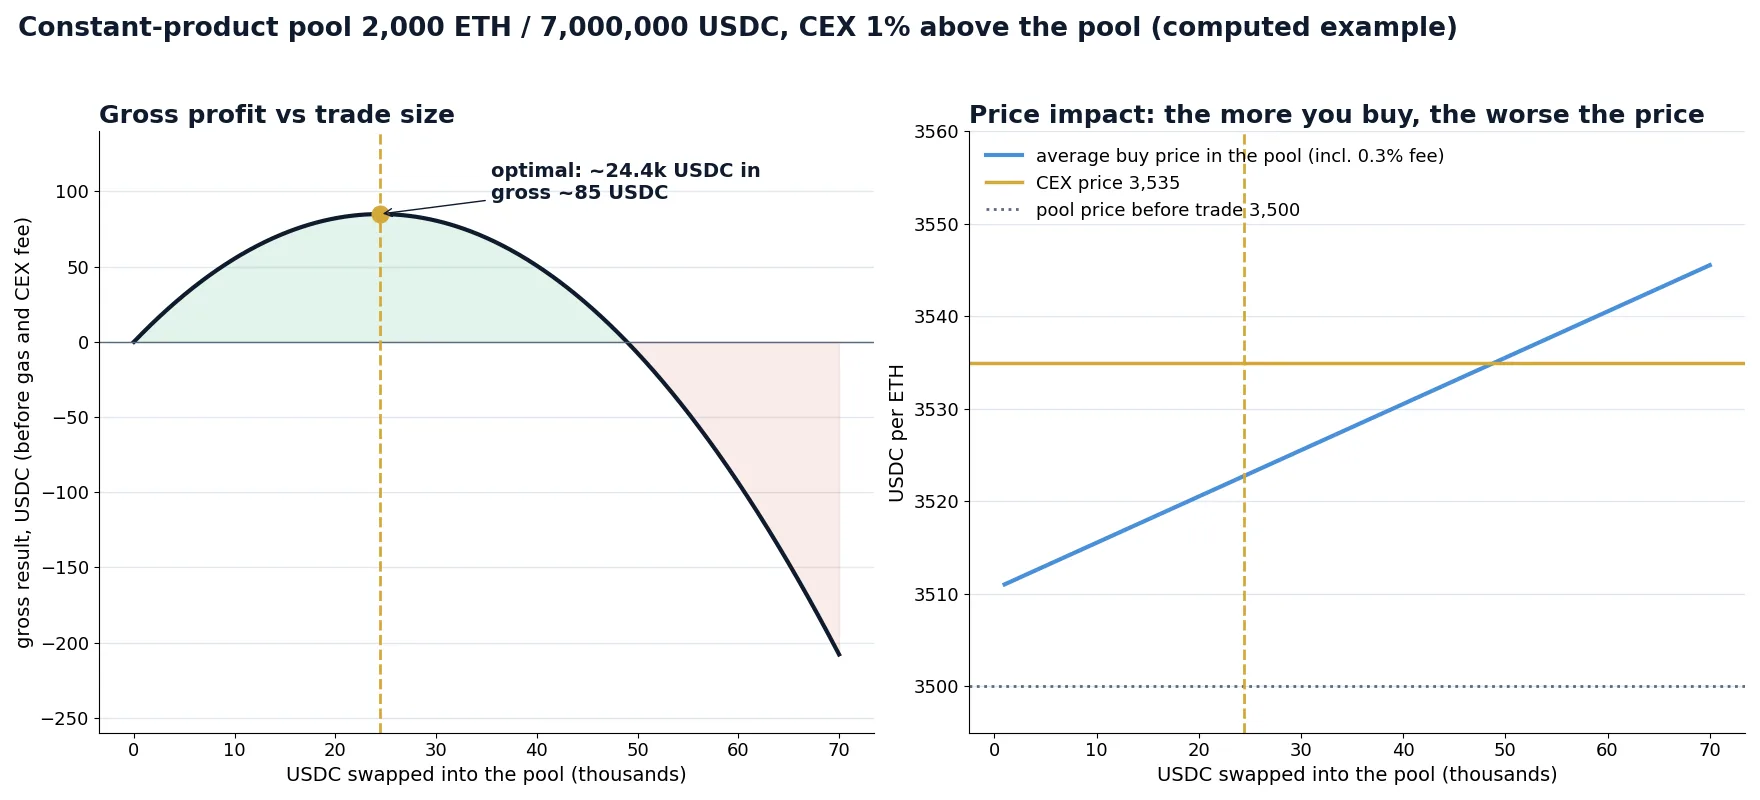
Suppose ETH is 3,535 on the centralized exchange, 1% above the pool. Buying ETH from the pool and selling it on the CEX is profitable only while the pool’s marginal price (including the fee) is below 3,535. As you buy, the pool price rises. The optimal trade is the one that pushes the pool’s marginal price, after fee, exactly to the centralized price. Buy less and you leave profit on the table; buy more and the last units cost more than you can sell them for.
For a constant-product pool with fee f, the optimal input has a closed form:
With f = 0.3% the optimal input is about 24,400 USDC. It buys about 6.95 ETH at an average price of about 3,523, and the pool ends at about 3,524.5. At that point, adding the 0.3% fee, the next ETH would cost about 3,535: the market price. The table shows what happens at other sizes.
| USDC in | ETH out | Average buy price | Value on CEX at 3,535 | Gross result |
|---|---|---|---|---|
| 10,000 | 2.845 | 3,515.5 | 10,055 | +55 |
| 20,000 | 5.681 | 3,520.5 | 20,082 | +82 |
| 24,400 (optimal) | 6.948 | 3,522.8 | 24,560 | +85 |
| 40,000 | 11.330 | 3,530.5 | 40,051 | +51 |
| 60,000 | 16.947 | 3,540.5 | 59,906 | −94 |
Constant-product pool, 2,000 ETH / 7,000,000 USDC, 0.3% pool fee, centralized price 3,535. Gross result is before gas, centralized-exchange fees and any payment for block position. Figures rounded.
Concentrated liquidity changes the depth, not the logic
Concentrated-liquidity pools (Uniswap v3 and v4 style, and their equivalents on other chains) let liquidity providers place capital in price ranges. Near the current price such a pool can be many times deeper than a constant-product pool with the same total value, so the same trade moves the price less and the optimal size is larger. When the price crosses the edge of a range, depth can drop sharply. The method stays the same: simulate the swap against the actual pool state, tick by tick, and find the size at which the marginal price meets the centralized price. Never use a formula for one pool type on another.
Worked example: a 1% gap on an ETH/USDC pool
Now take the optimal trade from the table and walk it through every cost. The headline gap is 1% of about 24,400 USDC, so a naive estimate says 244 USDC. Here is where it goes:
| Step | Amount (USDC) | What it is |
|---|---|---|
| Naive “gap × size” | +244 | 1% of the input, as if the whole trade filled at the starting pool price |
| Pool fee 0.3% | −73 | Paid to liquidity providers on the input |
| Price impact | −86 | Your own trade moves the pool along the curve |
| Gross on-chain edge | +85 | What the AMM math actually allows |
| CEX taker fee 0.05% | −12 | Hedge sale of 6.95 ETH on the centralized exchange |
| Hedge slippage 0.02% | −5 | The CEX price moves while the hedge fills |
| Gas | −3 | One swap at a quiet time on mainnet; can be many times higher |
| Before block position | +65 | If you were the only arbitrageur |
| Priority fee / builder tip (illustrative 50%) | −32 | Paid to be first in the block; competitive |
| Net | about +33 | About 0.13% of the capital used, before inventory and infrastructure costs |
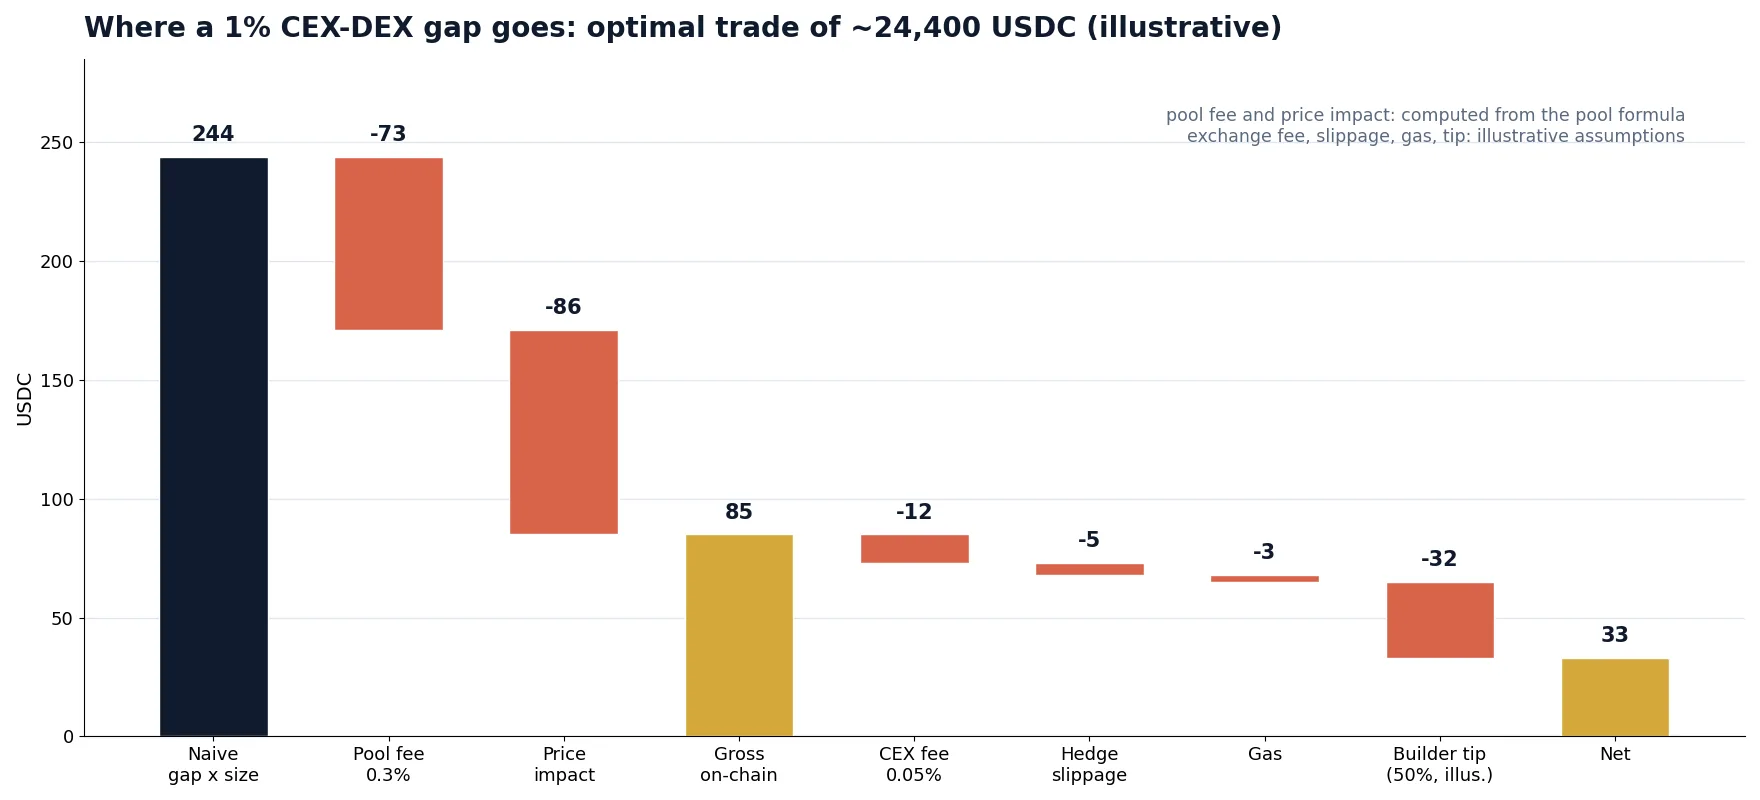
Three lessons follow from this one example:
- The visible gap is not the profit. On a 0.3% pool roughly two thirds of a 1% gap disappears in the pool fee and price impact before any external cost.
- Size is set by the pool, not by your capital. Having 1 million USDC does not help: anything above the optimal size loses money.
- The biggest variable cost is competition. The share paid for block position can range from small on a quiet pair to almost all of the edge on a contested one. When many bots see the same gap, they bid it away to the block producer.
Illustrative example built from the constant-product formula and stated assumptions. Real pools, fees and competition differ.
The no-trade band: how big the gap must be
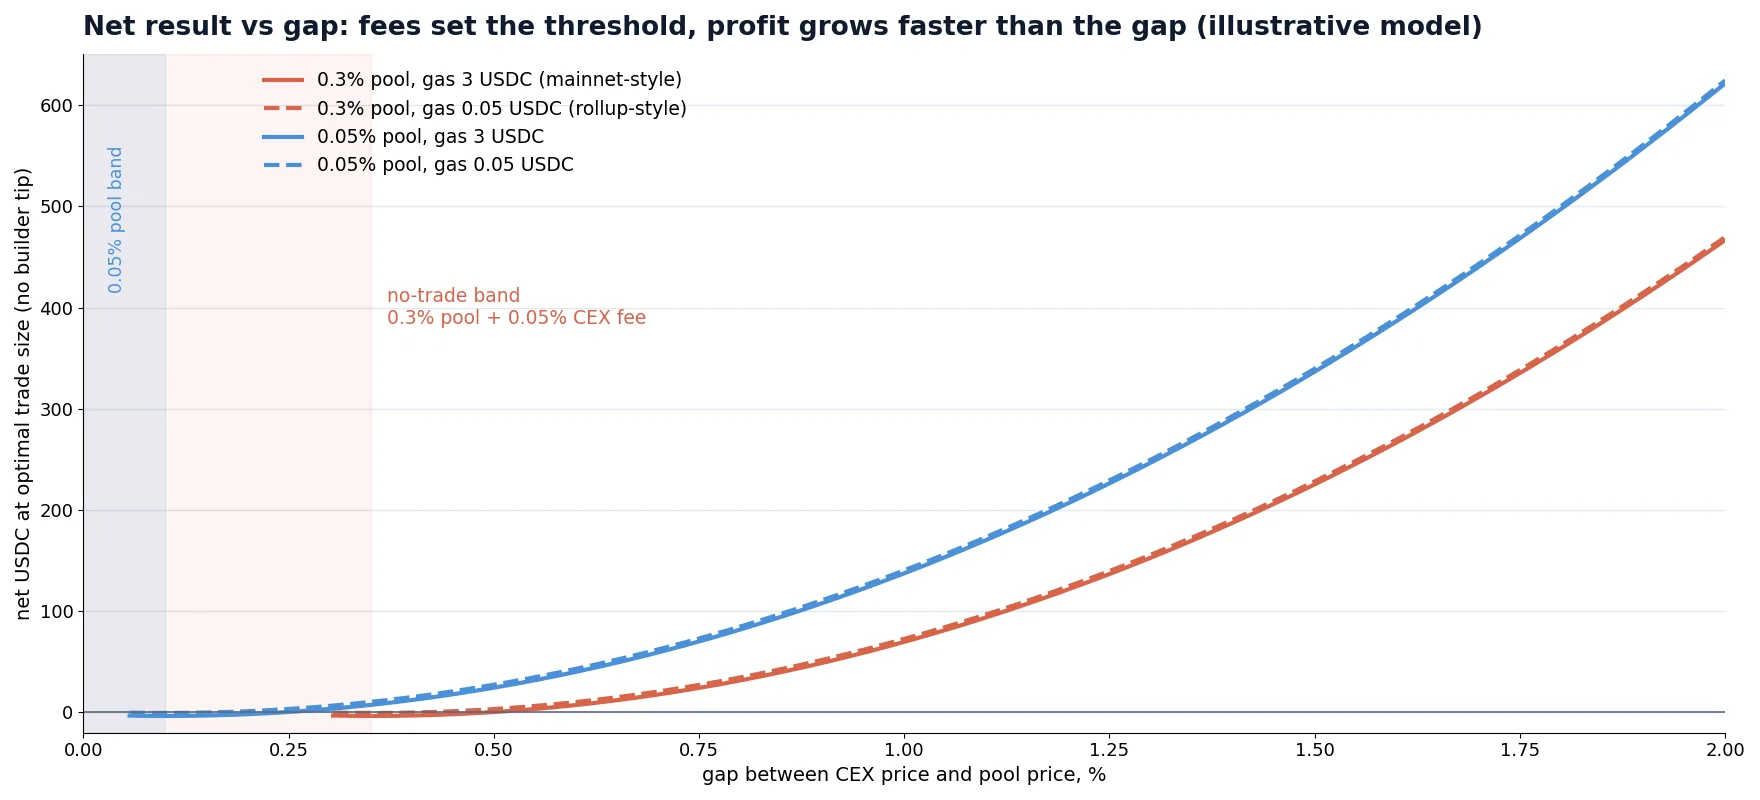
A useful rule of thumb: a CEX-DEX gap is only tradable once it exceeds the pool fee plus the centralized-exchange fee, and it becomes worth the effort only when it exceeds that sum by enough to pay gas and the block-position cost. Below that threshold, the optimal trade size is zero. This is the no-trade band.
The chart below holds the pool depth constant and compares a 0.3% pool with a 0.05% pool, each with mainnet-style gas (3 USDC) and rollup-style gas (0.05 USDC). The 0.05% pool here has the same depth as the 0.3% pool, which flatters it; in reality lower-fee pools are often the deep ones for major pairs, and the most contested.
| Gap | 0.3% pool, gas 3 | 0.3% pool, gas 0.05 | 0.05% pool, gas 3 | 0.05% pool, gas 0.05 |
|---|---|---|---|---|
| 0.2% | no trade | no trade | −2 | +1 |
| 0.4% | −3 | 0 | +12 | +15 |
| 0.6% | +7 | +10 | +40 | +43 |
| 1.0% | +70 | +73 | +137 | +140 |
| 2.0% | +467 | +470 | +621 | +624 |
Net USDC at optimal size, before builder tip, for the example pool (2,000 ETH / 7,000,000 USDC) with a 0.05% exchange fee. Illustrative model.
Two things stand out. First, profit grows much faster than the gap: doubling the gap from 1% to 2% multiplies the result by six or more, because both the optimal size and the margin per unit grow. That is why arbitrage bots care most about the rare large dislocations during sharp moves. Second, gas is decisive only near the threshold. On a cheap chain you can correct smaller gaps; on mainnet the small ones are not worth the transaction.
Two legs, no atomicity: execution risk
Purely on-chain arbitrage between two pools can be atomic: both swaps sit in one transaction, and if the result is unprofitable the transaction reverts. CEX-DEX arbitrage cannot be atomic. One leg is a blockchain transaction, the other is an order on a company’s matching engine. Something can always go wrong between them.
Which leg first?
| Order | Advantage | Risk |
|---|---|---|
| On-chain swap first, hedge after inclusion | You hedge only what actually filled; no hedge for a reverted swap | Exposure to the market from submission until the block is confirmed (up to one block or more) |
| CEX hedge first, then submit the swap | Locks the centralized price immediately | If the swap is not included, reverts or is beaten by another bot, you hold an unwanted position on the CEX |
| Both at once | Shortest total exposure | Both failure modes are possible; needs automatic unwind logic |
Professional searchers on fast chains usually send both legs almost simultaneously and manage the leftover position with automatic unwinding. Whatever the order, you need a clear rule for the failed case: how long you wait for inclusion, at what loss you close the orphaned leg, and how you avoid sending the same opportunity twice.
Protect the swap itself
A swap sent to a public mempool can be seen and copied, or front-run, by other bots. Two standard protections: a minimum-output parameter so the swap reverts instead of filling at a bad price, and private submission (sending the transaction or bundle directly to block builders or through a protected relay instead of the public mempool). A reverted transaction may still cost gas on chains where failed transactions are included, which is one more reason to simulate before you send.
MEV, block builders and who wins the race
CEX-DEX arbitrage is a form of MEV (maximal extractable value): profit that depends on where a transaction sits in a block. Every bot that sees the gap wants to be the first swap after the pool goes stale. The block producer decides the order, so the bots compete by paying the producer.
- On Ethereum mainnet, blocks are assembled by specialized builders who run auctions for transaction order. Searchers send bundles with a payment to the builder; the highest effective bid tends to get the first slot. Measurement studies of mainnet CEX-DEX arbitrage (for example the 2025 paper “Measuring CEX-DEX Extracted Value and Searcher Profitability”) report that the activity is dominated by a small group of searchers, several of them closely tied to block builders, and that a large share of the gross value is passed to builders and validators.
- On rollups, a single sequencer orders transactions. Depending on the chain, ordering is first-come-first-served, priority-fee based, or sold through an auction for a short head start. Latency to the sequencer and the fee policy decide who wins.
- On high-throughput chains with sub-second blocks, competition is about network latency, the quality of the connection to the block producer and the side payments that chain’s ecosystem uses for priority.
The practical consequence: an independent trader with a home-built bot rarely wins the most visible CEX-DEX opportunities on major pairs. The edge of the winners is a combination of the fastest centralized-exchange market data, low-latency connections to builders or sequencers, large inventory on both sides, very low exchange fees from high volume tiers, and in some cases privileged order flow. What remains for smaller players tends to be long-tail tokens, less-watched pools and chains, and moments of extreme volatility, all of which carry more risk.
Chain choice: Ethereum, rollups and fast chains
The same strategy behaves very differently depending on where the pool lives. The table is a general orientation at the time of writing; block times, fee markets and ordering rules change with upgrades, so check each chain’s current documentation.
| Venue type | Block interval | How order is decided | Typical consequence |
|---|---|---|---|
| Ethereum mainnet | 12 seconds | Builder auctions (bundles with payments) | Largest pools, highest gas, intense competition; gaps build up for 12 seconds and are captured by the top bidder |
| Ethereum rollups | About 0.25 to 2 seconds, varies by rollup | Single sequencer: first-come, priority fee or time-boost auction | Very low gas, smaller gaps per block, latency to the sequencer is critical |
| High-throughput L1 chains | Sub-second | Leader-based, with chain-specific priority payments | Many small opportunities, fast reverts and spam, infrastructure-heavy |
Shorter blocks reduce the size of each mispricing, because the pool is corrected more often, but they increase the number of opportunities. Lower gas lowers the no-trade band. Neither changes the fact that the pool fee and the centralized-exchange fee set a floor under every trade.
Inventory, rebalancing and bridges
Because the two legs settle in different places, you need capital on both sides before you trade: stablecoins and tokens in an on-chain wallet, and the same assets on the centralized exchange. Every arbitrage trade in the same direction drains one side. After a run of “buy on DEX, sell on CEX” trades, your wallet holds mostly ETH and your exchange account mostly USDC.
Rebalancing means moving funds between the wallet and the exchange: deposits, withdrawals, sometimes a bridge between chains. Each transfer has a fee, a confirmation time and price risk while funds are in transit. We have quantified those costs in detail in withdrawal fees, networks and transfer times for cross-exchange arbitrage; the same arithmetic applies here. A practical rule: amortize the expected rebalancing cost over the number of trades one rebalance supports, and add it to the minimum gap. A strategy that looks profitable trade by trade can lose money once rebalancing is counted.
Bridges add a separate category of risk: smart-contract failures, paused withdrawals and delays. Keep bridged balances as small as the strategy allows.
Step by step: evaluating an opportunity
Before you automate anything, run every candidate gap through the same checks. This is the sequence a CEX-DEX bot has to perform within milliseconds; doing it by hand first shows you which inputs matter.
1
2
3
4
5
6
7
Risks and limitations
- Competition risk: on major pairs the gap is usually taken within the same block by faster or better-connected searchers. Lost races may still cost gas.
- Leg risk: one leg fills and the other does not, leaving you with an open position during a volatile move, which is exactly when gaps appear.
- Smart-contract risk: a pool, router or bridge can contain bugs or be exploited. Interact only with audited, widely used contracts, and limit approvals.
- Token risk: long-tail tokens can have transfer taxes, blacklists, paused contracts or fake pools with the same name. A large gap on an obscure token is often a trap, not an opportunity.
- Exchange risk: deposits and withdrawals can be suspended for a network, API keys can be rate-limited, accounts can be reviewed. Keep exposure per exchange within limits you can afford to have frozen.
- Operational risk: private key management, node reliability and monitoring are part of the strategy. A single leaked key ends it.
- Regulatory and tax: rules on DeFi activity and on reporting many small trades differ by country. Check your situation before scaling.
CEX-DEX or CEX-CEX: which suits you
CEX-DEX arbitrage is a legitimate and important part of how crypto markets stay aligned. It is also one of the most crowded activities in the space, dominated on major pairs by teams with builder relationships and deep inventory. If you are choosing where to start, compare it honestly with arbitrage between centralized exchanges:
| Aspect | CEX-DEX | CEX-CEX |
|---|---|---|
| Where prices differ | Pool lags the order-book market between blocks | Exchanges and their feeds react to moves at different speeds |
| Main cost | Pool fee, price impact, gas, payment for block position | Trading fees, spread, slippage, transfers between exchanges |
| Atomic? | No: blockchain leg plus exchange leg | No: two exchange orders, but both on fast matching engines |
| Infrastructure | Nodes, private relays, wallet security, exchange APIs | Exchange APIs, fast feeds, a server near the exchanges |
| Who competes | MEV searchers with builder links | Arbitrage and market-making firms, retail bots |
BJF Trading Group’s crypto tools work on the centralized side: the free crypto arbitrage scanner shows price differences between centralized exchanges in real time, and VIP Crypto Arbitrage runs one-leg and hedge arbitrage across more than 50 centralized spot and futures exchanges through their native APIs. They do not trade against DEX pools. For the bigger picture of cross-exchange strategies, see our crypto arbitrage overview; for delta-neutral alternatives that do not depend on winning a block race, the funding rate arbitrage and spot-futures basis trading guides go through the numbers.
See real price gaps between exchanges first
Before you build infrastructure for any arbitrage, watch how often gaps appear, how large they are after fees and how long they last. The free scanner shows it live for centralized exchanges.
Get the free Crypto Arbitrage ScannerVIP Crypto Arbitrage software
Free arbitrage scanner + short email course
Get the free scanner link and a few short, practical emails from Boris: what a price gap really means after costs, how to test a strategy before risking real money, and which tools fit your market. No hype.
FAQ
What is CEX-DEX arbitrage?
It is buying a token on a decentralized exchange pool and selling it on a centralized exchange, or the reverse, when the prices differ by more than the total cost. Pools only reprice when someone swaps, so they lag the centralized market, and arbitrageurs bring them back in line.
Is CEX-DEX arbitrage still profitable?
For a small number of specialized searchers, yes, but on major pairs most of the gross value is paid away in pool fees, price impact, gas and payments to block builders. Independent traders mostly find remaining edges on less-watched pools and chains, where token and contract risks are higher.
How big must a price gap be to arbitrage a DEX pool?
At least the pool fee plus the centralized-exchange fee, and more to cover gas, hedge slippage and block-position costs. On a 0.3% pool with a 0.05% exchange fee, gaps below about 0.4% are usually not tradable at all.
Why is a 1% gap not 1% profit?
Because your own swap moves the pool price along its curve, and the pool fee is charged on the input. In our example pool a 1% gap on the optimal trade of about 24,400 USDC gives about 85 USDC gross, around 0.35%, before any external cost.
Can CEX-DEX arbitrage use a flash loan?
Not for the full trade. A flash loan must be repaid in the same transaction, and the centralized-exchange leg happens outside the blockchain. Flash loans fit purely on-chain arbitrage between pools; CEX-DEX arbitrage needs your own inventory on both sides.
In CEX-DEX arbitrage, which leg goes first?
Either can work. Swapping first means you hedge only what filled but carry market risk until the block is confirmed; hedging first locks the price but leaves a position if the swap fails. Most automated systems send both quickly and unwind any orphaned leg by rule.
Does BJF software trade on decentralized exchanges?
No. BJF’s crypto arbitrage tools work with centralized exchanges through their APIs. The free scanner and VIP Crypto Arbitrage cover price differences between centralized exchanges.
This article is educational and does not constitute financial advice. Numerical examples use a stated model pool and assumptions; charts and figures marked as illustrative are not measurements of any specific exchange, pool or trader. Fees, block times and ordering rules change over time.
