Forex Market Hours and Liquidity by Hour: When Trading Algorithms Should (and Shouldn’t) Trade Sunday November 22nd, 2026 – Posted in: Arbitrage Software, Forex trading
Forex Market Hours and Liquidity by Hour: When Trading Algorithms Should (and Shouldn’t) Trade
The forex market is open 24 hours a day, five days a week, but it is not equally liquid all day. Price movement, spreads and order-book depth change sharply from hour to hour as Sydney, Tokyo, London and New York take turns. This guide shows the session hours in UTC, real hourly data for six currency pairs, the scheduled events that create spikes, how daylight saving time and broker server time shift everything by an hour, and how to turn all of that into a session filter for a trading algorithm.
- Forex market hours: the short answer
- The four trading sessions in UTC
- What liquidity means for an algorithm
- Real data: activity by hour for six pairs
- Day of the week and the news hours
- Fixes, data releases and rollover
- Cost per move: why the same spread costs more at night
- Which hours suit which strategy
- Daylight saving time, server time and holidays
- Building a session filter step by step
- Measuring the profile on your own broker
- Risks and limitations
- FAQ
Forex market hours: the short answer
Forex trades from Sunday about 22:00 UTC to Friday 22:00 UTC (5 pm New York time). Liquidity and price movement are highest when London is open, and especially during the London-New York overlap (roughly 13:00-17:00 UTC in winter, 12:00-16:00 UTC in northern summer). They are lowest in the late New York afternoon, around the daily rollover at 5 pm New York time, and at the Sunday open. For an algorithm, the “best time to trade” depends on the strategy: arbitrage and breakout systems want the liquid hours, while some mean-reversion systems prefer quiet hours with tight spreads. Almost every strategy should avoid the rollover window and the first minutes of the week.
Global foreign-exchange turnover reached about 9.6 trillion US dollars per day in April 2025, according to the Bank for International Settlements’ Triennial Survey. That volume is not spread evenly across the clock: it is concentrated in a few trading centres, with London the largest, followed by New York, and then Singapore, Hong Kong and Tokyo. When those centres are open, there are more dealers quoting, more orders in the books and more news. When they are closed, the same currency pair is a different market.
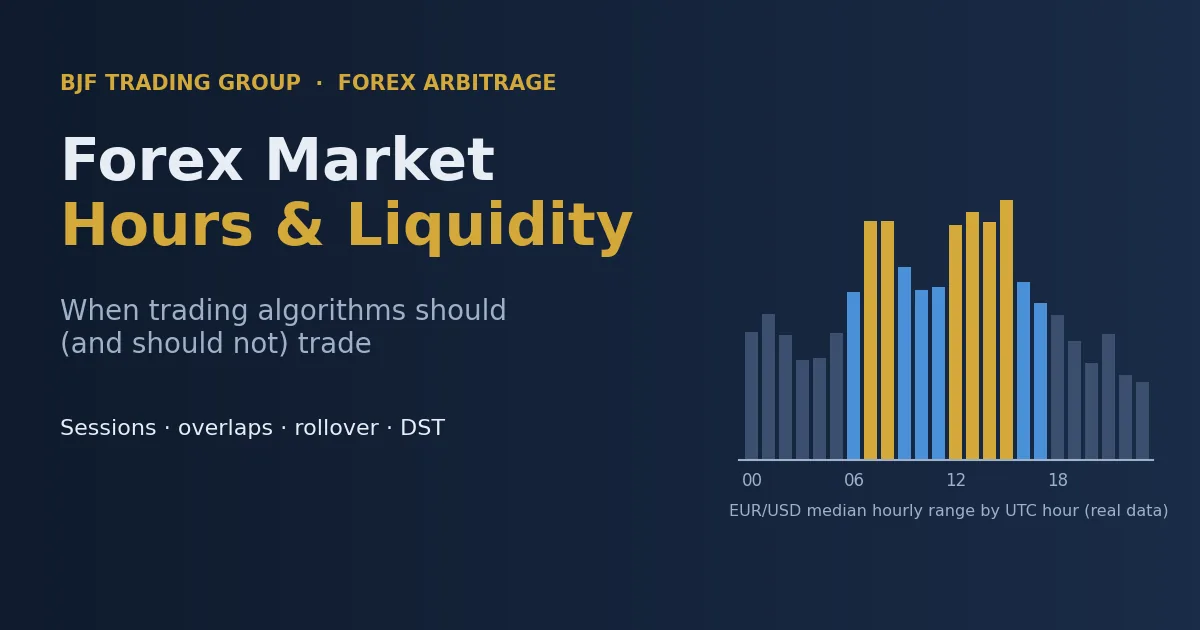
We measured this directly. Using about 12 weeks of real hourly bars (31 August to 20 November 2026) for six pairs, the typical hourly price range of EUR/USD was more than three times larger at the busiest hour than at the quietest:
Data: Yahoo Finance hourly FX bars (indicative, not tradable broker quotes), our own calculation. Numbers describe the past sample, not a forecast.
The four trading sessions in UTC
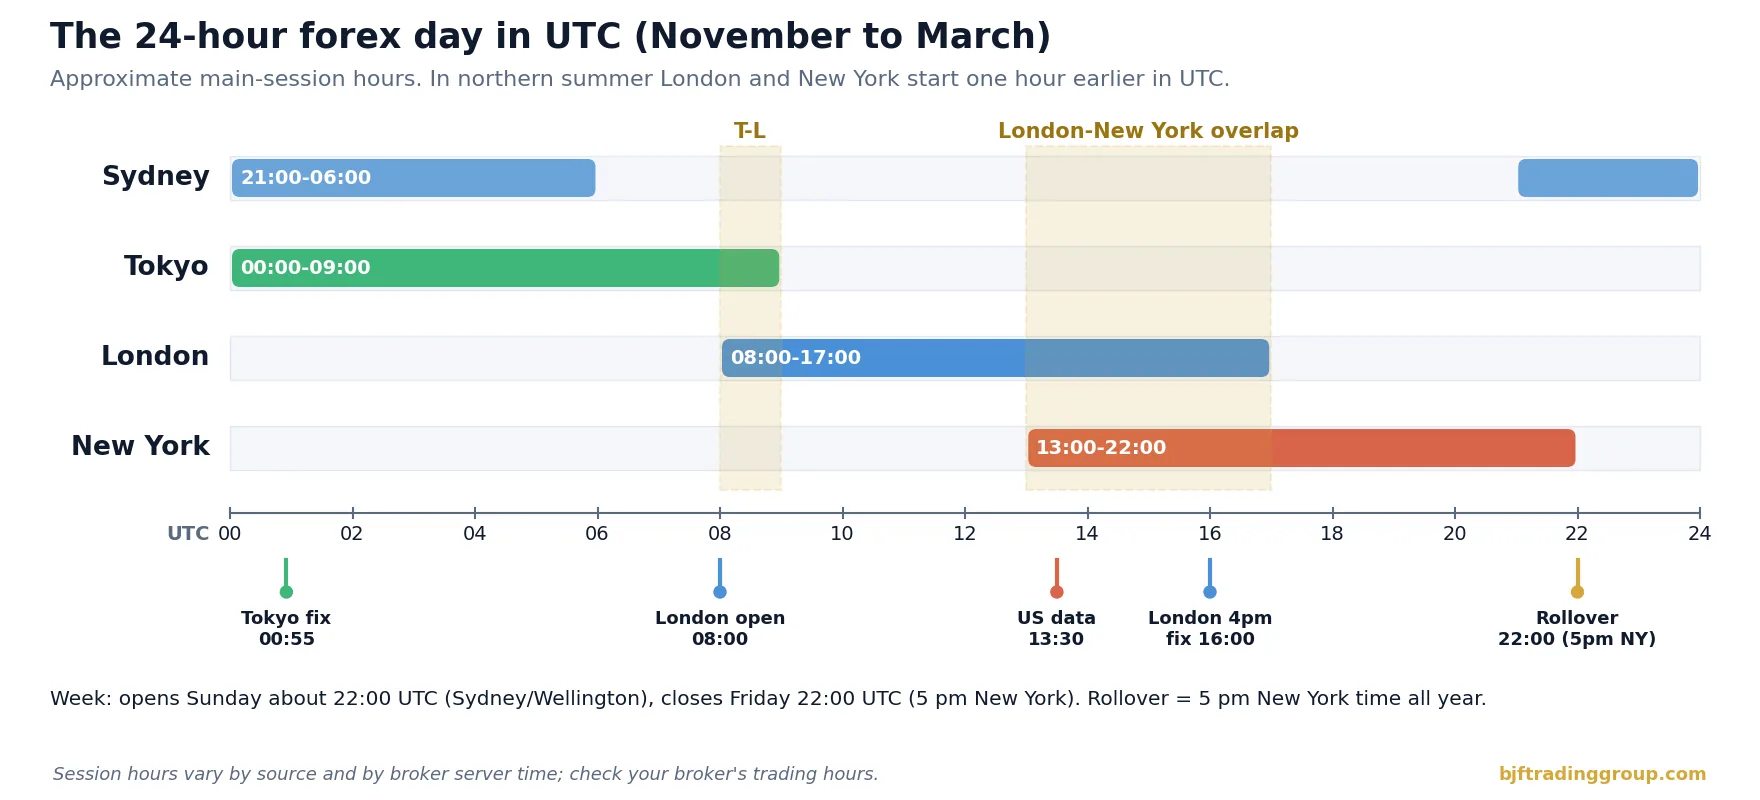
There is no official opening bell in spot forex. The market is a network of banks, non-bank market makers, electronic venues and brokers, and “sessions” are a convention based on the business hours of the main trading centres. Different sources quote slightly different hours. The table below uses common approximate values in UTC, which is the only time zone that does not move.
| Session | Winter (Nov-Mar), UTC | Summer (Mar-Oct/Nov), UTC | Most active pairs | Character |
|---|---|---|---|---|
| Sydney | 21:00-06:00 | 22:00-07:00 | AUD, NZD crosses | Thin; the week opens here |
| Tokyo (Asia) | 00:00-09:00 | 00:00-09:00 | USD/JPY, AUD/USD, JPY crosses | Moderate; Tokyo fix at 9:55 Tokyo time |
| London (Europe) | 08:00-17:00 | 07:00-16:00 | EUR, GBP, CHF and all majors | Largest centre; open brings a jump in activity |
| New York | 13:00-22:00 | 12:00-21:00 | USD pairs, USD/CAD | US data at 8:30 New York time; quiet after the London close |
Two overlaps matter. The short Tokyo-London overlap is a transition hour. The London-New York overlap, about four hours long, is where the largest dealers on both sides of the Atlantic are active at the same time, where US economic data is released and where the London 4 pm fix takes place. Japan does not use daylight saving time, Australia shifts in the opposite direction to the northern hemisphere, and the UK and the US change clocks on different dates, so session boundaries in UTC move several times a year.
What liquidity means for an algorithm
“Liquidity” is often used loosely. For a trading system it has four measurable parts, and they do not always move together:
| Dimension | What it measures | How to observe it | Why it matters |
|---|---|---|---|
| Spread | Cost of crossing from bid to ask | Your broker’s tick stream, per hour | Direct cost of every round trip |
| Depth | Volume available at or near the best price | Order book or partial fills on larger orders | Slippage on size, partial fills |
| Activity (range, tick count) | How much and how often price moves | Hourly high-low range, ticks per minute | Opportunity for strategies that need movement |
| Resilience | How quickly the book refills after a trade | Spread recovery time after spikes | Fill quality of the second leg and of exits |
The busy hours usually have tight spreads, deep books and a lot of movement at the same time. The quiet hours usually have wider spreads, thinner books and less movement. But there are exceptions that catch algorithms out: the seconds after a major data release have huge movement and very poor depth, and the rollover window can show a large “range” on a chart that is really just the spread opening up, not the price moving. The detailed mechanics of spread blowouts are covered in our guide to why forex spreads widen at rollover and around news; this article focuses on the clock itself.
Real data: activity by hour for six pairs
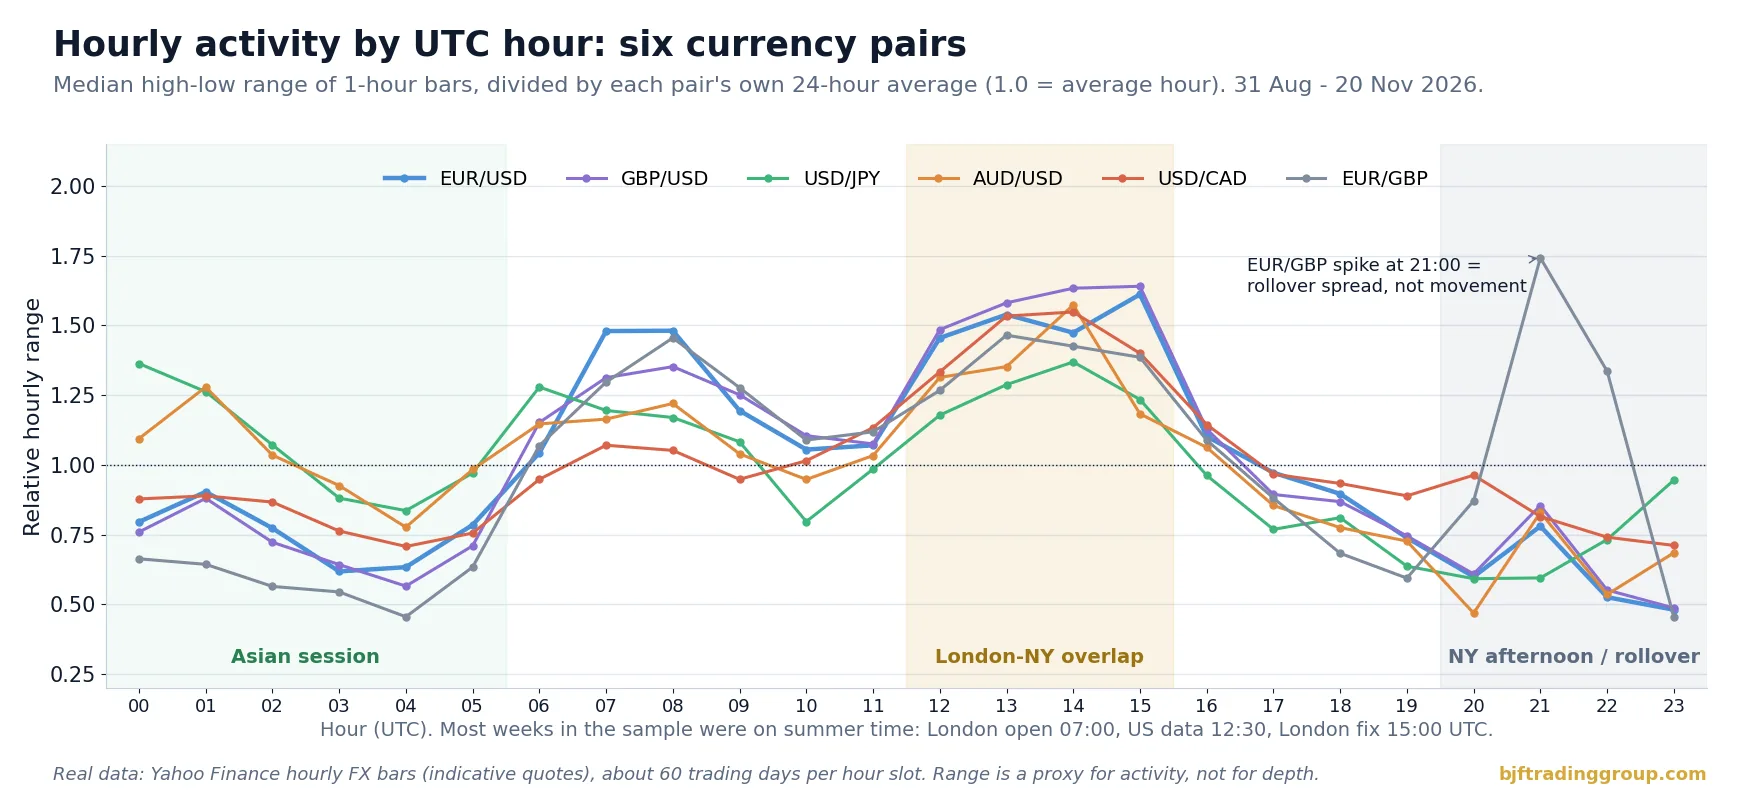
To see the daily cycle without relying on textbook diagrams, we took public hourly bars for EUR/USD, GBP/USD, USD/JPY, AUD/USD, USD/CAD and EUR/GBP from 31 August to 20 November 2026 (about 60 observations for each hour of the day) and computed the median high-low range of each hour in pips. To compare pairs with different volatility, the chart divides each hour by the pair’s own 24-hour average, so 1.0 means an average hour.
What the data shows:
- The London open is a step change. EUR/USD’s median range rises from about 6.6 pips at 05:00 UTC to 12.5 pips at 07:00 UTC, the first hour of London trading in summer time.
- The overlap is the peak. All six pairs reach 1.4-1.6 times their average hour between 12:00 and 15:00 UTC. EUR/USD peaks at 13.6 pips at 15:00 UTC, the hour of the London 4 pm fix in summer time.
- The yen has its own morning. USD/JPY’s median range at 00:00 UTC (24.3 pips) is almost as large as its peak at 14:00 UTC (24.4 pips). For yen pairs the Tokyo session is not “the quiet session”.
- AUD/USD wakes up in Asia. It is above its daily average at 00:00-02:00 UTC, while the euro and pound are well below theirs.
- The late New York afternoon is the quietest part of the day. EUR/USD falls to 4-5 pips per hour from 20:00 UTC, and GBP/USD to about 5 pips.
- The EUR/GBP spike at 21:00 UTC is not a move. It is the highest hour of the day for this pair (8.8 pips), but it coincides with the rollover in summer time. Indicative quotes widen, and the high-low range captures the spread, not tradable movement. This is a good example of why range alone must not be read as liquidity.
| Pair | Busiest hour (UTC) | Median range | Quietest hour (UTC) | Median range | Ratio |
|---|---|---|---|---|---|
| EUR/USD | 15:00 | 13.6 pips | 23:00 | 4.1 pips | 3.4x |
| GBP/USD | 15:00 | 16.6 pips | 23:00 | 4.9 pips | 3.4x |
| USD/JPY | 14:00 | 24.4 pips | 20:00 | 10.6 pips | 2.3x |
| AUD/USD | 14:00 | 10.1 pips | 20:00 | 3.0 pips | 3.4x |
| USD/CAD | 14:00 | 20.9 pips | 04:00 | 9.6 pips | 2.2x |
| EUR/GBP | 13:00 (excluding the 21:00 rollover artefact) | 7.4 pips | 04:00 | 2.3 pips | 3.2x |
Source: Yahoo Finance hourly bars, 31 Aug – 20 Nov 2026, our calculation. Indicative quotes; your broker’s ranges and spreads will differ.
Day of the week and the news hours
The hourly cycle is not the same every day. The heatmap below splits EUR/USD’s median hourly range by weekday and hour. Two patterns stand out.
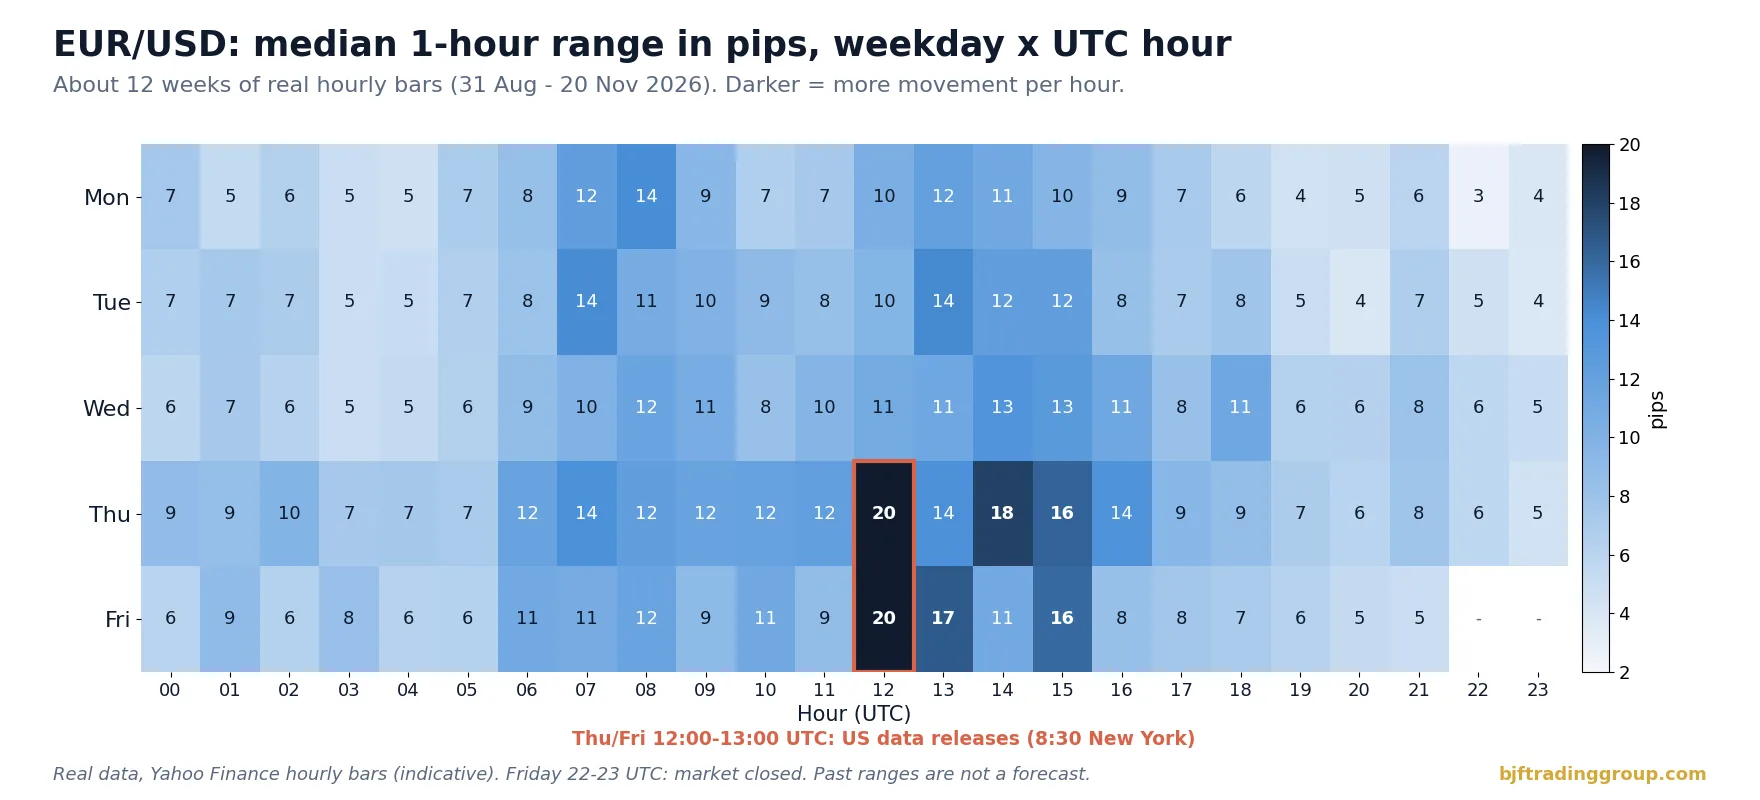
First, Thursday and Friday at 12:00 UTC carry a median range of about 20 pips, roughly twice the same hour earlier in the week. In the sample period, the 8:30 New York data releases (weekly jobless claims on Thursdays and several monthly reports, including the employment report, on Fridays) fell in that hour. Second, Monday’s late evening is the quietest slot of the week, with a median of under 3 pips at 22:00 UTC. Wednesday is also worth noting for a different reason: in most of the market the rollover from Wednesday to Thursday carries a triple swap for the weekend, which matters for positions held overnight (see our guide to swap and rollover arbitrage).
Fixes, data releases and rollover: the scheduled spikes
Many of the hours that look special in the data are tied to scheduled events. They happen at fixed local times, which makes them easy to put into a calendar and a strategy filter.
| Event | Local time | UTC (winter / summer) | Effect for an algorithm |
|---|---|---|---|
| Weekly open | Sunday, 5 pm New York | 22:00 / 21:00 Sunday | Wide spreads, weekend gaps, few quotes for the first minutes |
| Tokyo fix | 9:55 Tokyo | 00:55 / 00:55 | Flows in USD/JPY and yen crosses |
| London open | 8:00 London | 08:00 / 07:00 | Step increase in activity, spreads tighten |
| US economic data | 8:30 New York | 13:30 / 12:30 | Seconds of extreme movement, spread spikes, slippage |
| London 4 pm fix (WM/R) | 4:00 pm London | 16:00 / 15:00 | Large flows around the fixing window, especially at month-end |
| Daily rollover | 5:00 pm New York | 22:00 / 21:00 | Spreads widen for minutes, swaps are applied, liquidity is thinnest |
| Weekly close | Friday, 5 pm New York | 22:00 / 21:00 Friday | Positions held over the weekend carry gap risk |
Central bank decisions and speeches add unscheduled-looking spikes to this list, although their dates are published in advance. A practical rule is to treat every high-impact release as a short blackout window for new entries, and to set tighter limits on the orders that close existing positions during it. Our article on forex slippage shows how to measure what these windows actually cost on your account.
Cost per move: why the same spread costs more at night
The most useful way to think about hours is not “busy versus quiet” but “cost relative to movement”. A strategy that needs price to move a certain distance pays the spread and commission once per round trip. If the hour offers little movement, the same cost eats a larger share of every trade.
Take EUR/USD with the median hourly ranges measured above, and assume illustrative all-in costs (spread plus commission) that a typical raw-spread account might show in each period:
| Hour (UTC) | Median range (measured) | Illustrative all-in cost | Cost as share of the hourly range |
|---|---|---|---|
| 13:00 (overlap) | 13.0 pips | 0.3 pips | 2.3% |
| 07:00 (London open) | 12.5 pips | 0.3 pips | 2.4% |
| 03:00 (Asia) | 5.2 pips | 0.5 pips | 9.6% |
| 23:00 (after rollover) | 4.1 pips | 0.8 pips | 19.7% |
| 21:00-22:00 (rollover minutes) | not meaningful | 2-5 pips or more | Often larger than the expected move |
Ranges are measured; costs are illustrative assumptions. Measure your own broker’s spread by hour before using numbers like these.
The formula is simple and worth putting into any strategy review:
cost share = (spread + commission + expected slippage) / typical move per trade in that hour
If the typical move a strategy captures is 3 pips and costs are 0.3 pips, costs take 10% of the gross edge. At an hour where the same move shrinks to 1.5 pips and costs widen to 0.8 pips, costs take more than half. Nothing about the strategy has changed; only the clock has. For a deeper look at account cost structures, see how liquidity providers and aggregators shape the spread you receive.
Which hours suit which strategy
There is no single best time to trade forex. There is a best time for a given strategy, pair and broker. The table below is a starting point for a schedule, not a rule.
| Strategy type | Needs | Usually prefers | Usually avoids |
|---|---|---|---|
| Latency and price-feed arbitrage | Fast movement on a reference feed, tight spreads, reliable fills | London session and the London-New York overlap | Rollover, Sunday open, the first seconds of major releases |
| Two-leg arbitrage between brokers | Depth on both sides, synchronized quotes | Overlapping business hours of both liquidity sources | Hours when one side is thin (rollover, holidays) |
| Mean reversion / range trading | Price oscillating in a band, low trend | Calm Asian hours on EUR and GBP pairs, if spreads stay tight | Session opens, news, rollover spreads |
| Breakout / momentum | Directional moves, volume | London open, New York open, the overlap | Late New York afternoon |
| News trading | Defined event windows | Only its own release windows | Everything else |
| Statistical arbitrage / pairs | Stable relationships, tradable costs on both legs | Liquid hours for both instruments | Hours when one leg’s spread widens |
For latency arbitrage specifically, the busy hours bring both more opportunities and more competition, while the quiet hours bring fewer signals and much higher costs per signal. The choice of trading hours is therefore an optimization problem, not a fixed rule: run the same strategy with different time windows in a backtest or an optimizer, and compare net results per hour rather than only total profit.
Daylight saving time, server time and holidays: the scheduling traps
Most scheduling bugs in trading systems are not about strategy logic. They come from clocks.
Daylight saving time moves the sessions in UTC
The UK and the EU move their clocks on the last Sunday of March and October. The US moves on the second Sunday of March and the first Sunday of November. For two to three weeks each spring and for one week each autumn, London and New York are four hours apart instead of five. In autumn 2026, for example, the UK returned to GMT on 25 October and the US to standard time on 1 November; during that week the London open was at 08:00 UTC while US data was still released at 12:30 UTC and the rollover happened at 21:00 UTC. In spring 2027 the gap runs from 14 March (US) to 28 March (UK). A schedule written in fixed UTC hours is wrong for part of every year.
The safe approach is to define each window in the time zone that owns it: rollover and US data in New York time, the London open and the London fix in London time, the Tokyo fix in Tokyo time. Then convert to UTC at run time using a time-zone library, not a hard-coded offset.
Broker server time is yet another clock
Many brokers run their servers on a time zone chosen so that daily candles close at 5 pm New York time, commonly UTC+2 in winter and UTC+3 in summer. Others use UTC or their local time. A filter that blocks “23:00-23:30” can therefore mean three different moments depending on which clock the platform uses. Always check which time your platform, your logs and your broker’s trading-hours page refer to, and log timestamps in UTC.
Holidays and thin days
When one major centre is closed, the market stays open but behaves like its quiet hours for longer. Typical examples are US Thanksgiving and the following Friday, the period between Christmas and New Year, UK bank holidays, and Golden Week in Japan for yen pairs. Brokers often publish reduced trading hours for these days. Treat them like an extended rollover: smaller size, wider limits on closing orders, or no new trades.
Building a session filter step by step
A session filter sits in front of the entry logic. It does not create trades; it decides whether the strategy is allowed to open new positions now, and with what size and limits. Here is a practical sequence:
1
2
3
4
5
6
7
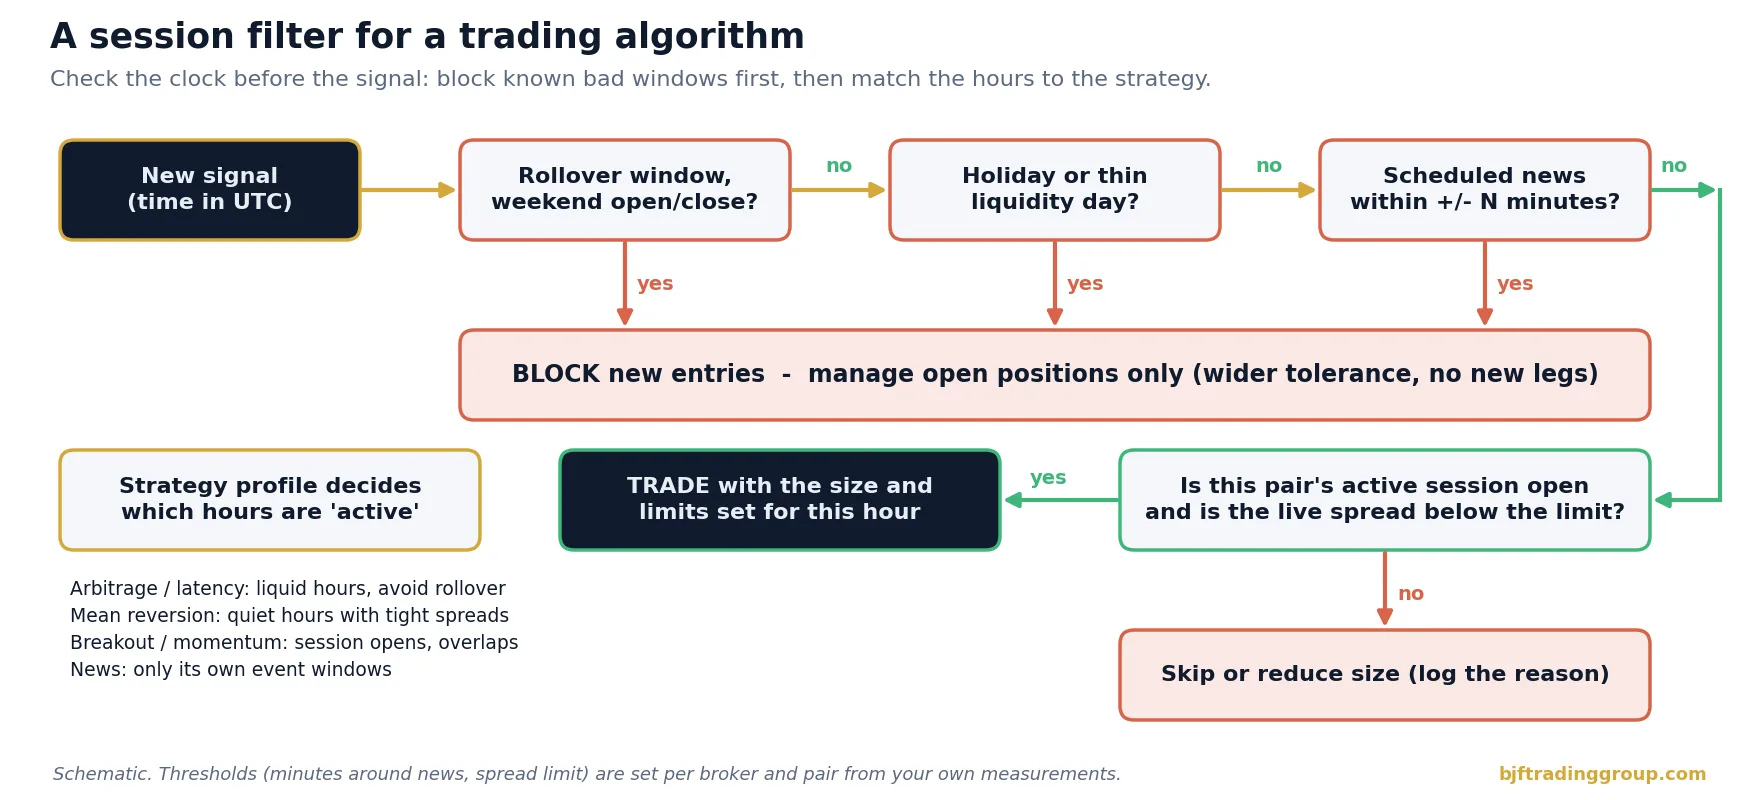
Note the order: blocking rules come first because they are cheap to evaluate and protect against the largest losses. The live-spread check comes last because it reacts to conditions no calendar can predict, such as a liquidity provider withdrawing quotes or an unexpected headline.
Measuring the profile on your own broker
Public data like the charts above shows the general shape of the day. Your strategy trades on your broker’s feed, and that feed can look different: some brokers widen spreads earlier before rollover, some have thin liquidity in Asian hours on certain crosses, and execution quality can change with the liquidity providers active at each hour. A simple measurement routine:
- Record ticks for each pair you trade for at least four to six weeks, covering a daylight-saving change if possible.
- Compute per UTC hour: median and 90th percentile spread, tick count per minute, median 1-minute range, and the share of time the spread is above your limit.
- Compare with a reference feed to see in which hours your broker lags or quotes differently; our guide to forex tick data for backtesting describes quality checks for this kind of data.
- Add execution data: slippage, rejection rate and fill time per hour from your own trade log.
- Repeat after any change of broker, account type, server location or VPS, because latency and liquidity routing change the profile.
The result is a small table of 24 rows per pair. It is usually enough to set the session filter, the spread limits per hour and the size scaling, and it is far more reliable than generic “best time to trade” charts.
Risks and limitations
- Range is not depth. Our measurements use hourly high-low ranges from indicative quotes. They show activity, not how much volume you can trade at a given price.
- Short sample. About 12 weeks, mostly on northern summer time, in one market regime. Patterns are stable over years in general shape, but individual hours change with the news cycle.
- Averages hide extremes. A quiet hour can still contain a surprise headline, a flash move or a liquidity gap. Medians describe typical conditions, not the worst case.
- Broker differences. Spreads, server time, rollover handling and trading hours differ by broker and account type. Always measure on the account you trade.
- Filters reduce opportunities too. Blocking hours lowers risk and costs, but also removes some profitable trades. Decide with per-hour net results, not intuition.
- No guarantee. Nothing in this article is a forecast or financial advice. Trading foreign exchange with leverage carries a high risk of loss.
Trade the hours that pay, skip the ones that don’t
BJF Trading Group builds arbitrage and high-frequency trading software for forex and crypto markets. SharpTrader runs arbitrage strategies across brokers and exchanges; test your strategy on different time windows, compare net results by hour, and let the schedule follow the data.
Free arbitrage scanner + short email course
Get the free scanner link and a few short, practical emails from Boris: what a price gap really means after costs, how to test a strategy before risking real money, and which tools fit your market. No hype.
FAQ
What are the forex market hours in UTC?
Spot forex trades from about 22:00 UTC on Sunday to 22:00 UTC on Friday in winter, and one hour earlier in northern summer, because the week opens and closes at 5 pm New York time. Approximate session hours in winter are Sydney 21:00-06:00, Tokyo 00:00-09:00, London 08:00-17:00 and New York 13:00-22:00 UTC.
What is the most liquid time to trade forex?
The London-New York overlap, roughly 13:00-17:00 UTC in winter and 12:00-16:00 UTC in summer. In our data the major pairs moved 1.4 to 1.6 times more than in an average hour during this period, and spreads are usually at their tightest.
When should a trading algorithm not trade?
Most algorithms should avoid opening new positions around the daily rollover at 5 pm New York time, during the first minutes after the Sunday open, just before the Friday close, in the first seconds of high-impact data releases, and on holidays when a major centre is closed.
Why do spreads widen at 5 pm New York time?
That is the daily rollover, when the value date changes and many liquidity providers briefly pull or widen their quotes while positions are rolled and swaps are applied. Liquidity is at its thinnest for a few minutes, so brokers’ spreads widen sharply.
Is the Asian session good for algorithmic trading?
It depends on the pair and the strategy. Yen and Australian dollar pairs are active in Asian hours, while EUR and GBP pairs are quiet. Quiet hours can suit some mean-reversion systems if spreads stay tight, but they usually make cost per move higher for strategies that need price movement.
How does daylight saving time affect forex trading hours?
The UK and the US change clocks on different dates, Japan does not change at all and Australia changes in the opposite direction. Session times in UTC therefore shift by an hour several times a year. Define trading windows in the local time of the centre that owns them, such as New York time for rollover, and convert to UTC automatically.
Does the day of the week matter in forex?
Yes. In our EUR/USD sample the hour of US data releases on Thursday and Friday moved about twice as much as the same hour on Monday to Wednesday, and Monday evening was the quietest slot of the week. Wednesday’s rollover usually carries a triple swap for the weekend.
