平均足(Heikin Ashi)トレード戦略:計算式、シグナル、バックテストの落とし穴(無料 PDF) 2026年10月05日 – Posted in: Forex trading
平均足(Heikin Ashi)トレード戦略:計算式、シグナル、バックテストの落とし穴
平均足はノイズの多い価格チャートを、すっきりとしたトレンドの連続に変えてくれます。トレーダーに好まれる理由はそこにあります。一方で、平均足は実際の価格を隠してしまいます。そのため、多くの平均足戦略はバックテストでは見事な成績を示すのに、実運用では損失を出します。本ガイドでは、計算式、ローソク足の読み方、実践的なトレンドフォロー用テンプレート、そして実際の BTCUSDT データで行った検証結果を解説します。2ページの無料 PDF チートシート(英語版)も付いています。
計算式、5つのローソク足シグナル、戦略ルール、エントリー前チェックリスト、本記事のバックテスト結果を、印刷可能な2ページにまとめました(英語版)。
平均足とは
平均足(Heikin Ashi、日本語で「平均の足」)は、生の価格ではなく平均化した価格からローソク足を描く手法です。日本で生まれたこの手法は、2004年に Dan Valcu が Technical Analysis of Stocks & Commodities 誌の記事で紹介したことをきっかけに、欧米のトレーダーの間で広まりました。現在では、ほぼすべてのチャートプラットフォームに標準搭載されています。
通常のローソク足は、ある期間に実際に起きたこと、つまり価格がどこで始まり、どこまで動き、どこで終わったかをそのまま示します。平均足は同じ期間を平滑化し、前の足と混ぜ合わせたものを示します。その結果、トレンドは同じ色の足の長い連続として表れ、小さな逆行は吸収されます。
この平滑化こそが、この手法の長所であり弱点でもあります。
- 長所:トレンドが見やすく、ポジションを持ち続けやすくなり、多くのノイズが消えます。
- 弱点:足の反応が価格より遅れ、始値と終値は誰も実際に取引していない価格です。
平均足の計算式
各平均足は、現在の足の実際の始値・高値・安値・終値(OHLC)と、ひとつ前の平均足から計算されます。
| 値 | 計算式 | 意味 |
|---|---|---|
| HA 終値 | (Open + High + Low + Close) / 4 |
現在の足の平均価格 |
| HA 始値 | (previous HA Open + previous HA Close) / 2 |
前の HA 実体の中間点。最初の足は (Open + Close) / 2 |
| HA 高値 | max(High, HA Open, HA Close) |
実際の高値と HA 実体のうち最も高い値 |
| HA 安値 | min(Low, HA Open, HA Close) |
実際の安値と HA 実体のうち最も低い値 |
各 HA 始値はひとつ前の平均足に依存するため、系列全体が過去の足の影響を引き継ぎます。自分で計算する場合は、分析対象の期間より数十本前から計算を始め、初期値の影響がなくなるようにしてください。Python なら数行で計算できます。
ha_close = (o + h + l + c) / 4
ha_open = [(o[0] + c[0]) / 2]
for i in range(1, len(c)):
    ha_open.append((ha_open[-1] + ha_close[i - 1]) / 2)
ha_high = np.maximum.reduce([h, ha_open, ha_close])
ha_low = np.minimum.reduce([l, ha_open, ha_close])
平均足の読み方
平均足は、古典的なローソク足パターンではなく、色、実体の大きさ、ヒゲで読み解きます。目にする場面の大半は、次の5つで説明できます。
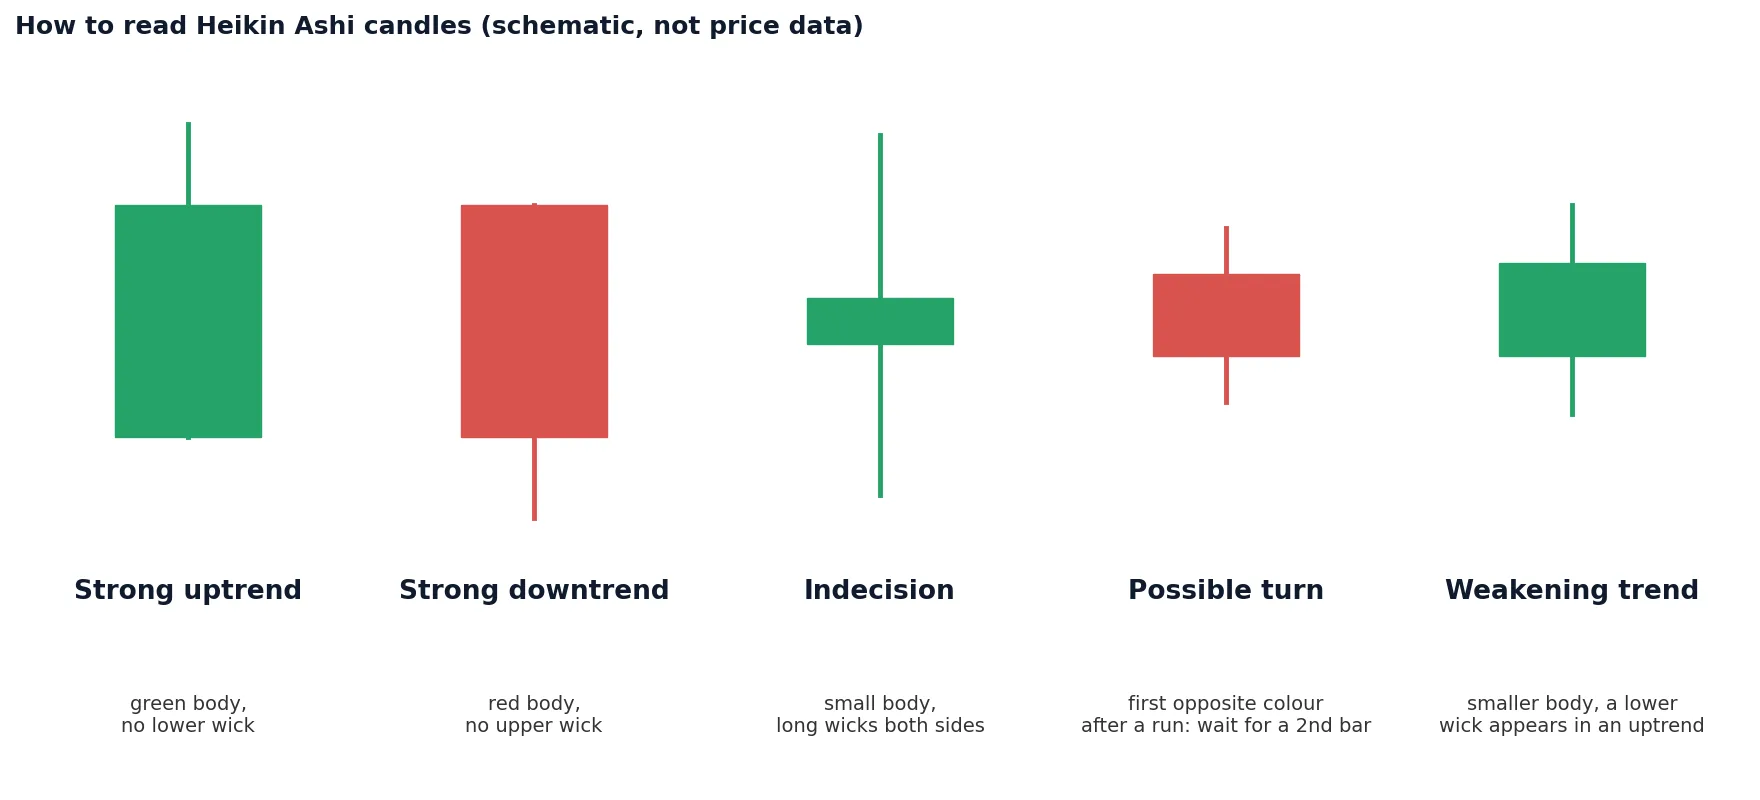
- 強い上昇トレンド:下ヒゲのない陽線。買い手が主導権を握っています。当社の BTCUSDT 日足データでは、平均足の陽線の49%に下ヒゲがまったくありませんでした。
- 強い下降トレンド:上ヒゲのない陰線。
- 迷い:実体が小さく、上下に長いヒゲがある足(平均足の「十字線」)。トレンドが一服している状態で、継続することも転換することもあります。
- 転換の可能性:長い連続の後に現れる、反対色の最初の足。1本だけではノイズであることが多いため、多くのトレーダーは2本目を待ちます。
- トレンドの弱まり:実体が小さくなり、「逆」側にヒゲが現れる(上昇トレンド中の下ヒゲ)。ドテンのシグナルではなく、ストップを引き締めるシグナルです。
実データで比較する平均足と通常のローソク足
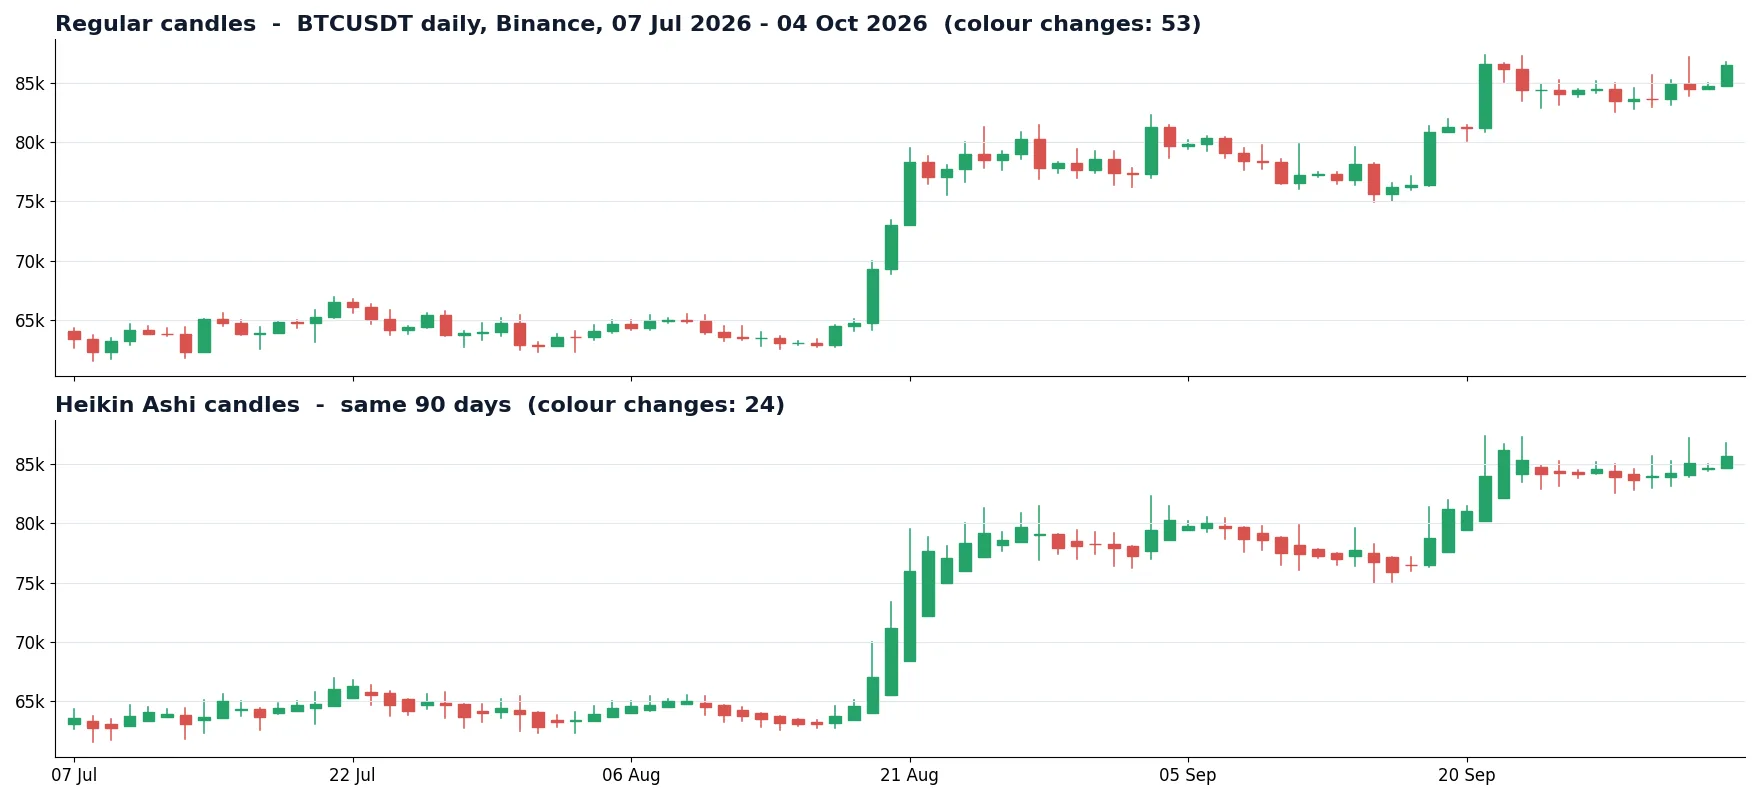
教科書の図ではなく実際の市場で違いを示すため、Binance の BTCUSDT 日足999本(2024年1月10日〜2026年10月4日)を取得し、そこから平均足を計算しました。
| BTCUSDT 日足、2024年1月〜2026年10月 | 通常のローソク足 | 平均足 |
|---|---|---|
| 色の切り替わり回数 | 512 | 239 |
| 同色の足の平均連続本数 | 1.95本 | 4.16本 |
| 最長連続 | 8本 | 23本 |
| HA 終値と実際の終値の差 | – | 中央値 0.63%、90パーセンタイル 1.92%、最大 8.0% |
平均足は色の切り替わり回数を半分以下に減らし、平均連続本数を2倍に伸ばしました。これこそが、トレンドに乗り続けやすくなる理由です。最後の行はその代償です。10日に1日は、平均足の終値がビットコインの実際の終値から1.9%以上離れていました。
平均足によるトレンドフォロー戦略
平均足は、上位の時間足(4時間足、日足)でのトレンドツールとして最も効果を発揮します。以下のテンプレートは、検証と調整のための妥当な出発点であり、完成したシステムや推奨ではありません。
- トレンドフィルター:実際の価格に基づく、より遅い指標の方向にのみ取引します。例えば、価格が50期間 EMA の上か下か、あるいはひとつ上の時間足の平均足の色などです。
- エントリー:反対色の連続の後、新しい色の平均足が2本連続するのを待ちます。理想的には、2本目にポジションと逆方向のヒゲがないことです。
- 損切り:実際のチャート上で、直近のスイングロー(買い)またはスイングハイ(売り)の外側に置きます。平均足の値にストップを置いてはいけません。取引可能な価格ではないからです。
- 決済:反対色の最初の足。長い連続の後に実体が縮み、トレンドと逆方向にヒゲが現れた場合は、それより早く決済します。
- ポジションサイズ:1回の取引で口座資金の一定割合をリスクにさらします。足が滑らかになっても、市場リスクは減りません。
レンジ相場では長い連敗を覚悟してください。価格が上下に揺れると平均足は何度も色を変え、そのたびに手数料とスリッページがかかります。トレンドフィルターは、そうした期間を避けるためにあります。モメンタムを利用したエントリーについては、インパルス・トレーディング戦略のガイドで詳しく解説しています。
バックテストの落とし穴:存在しない +3,796%
平均足で最もよくある間違いは、平均足の価格で戦略を検証することです。多くのチャートツールでは、チャートの種類を平均足に設定すると、デフォルトでこの方法が使われます。エントリーと決済が HA 始値や HA 終値で約定するのです。これらの値は平均値であり、誰もそこで売買することはできません。
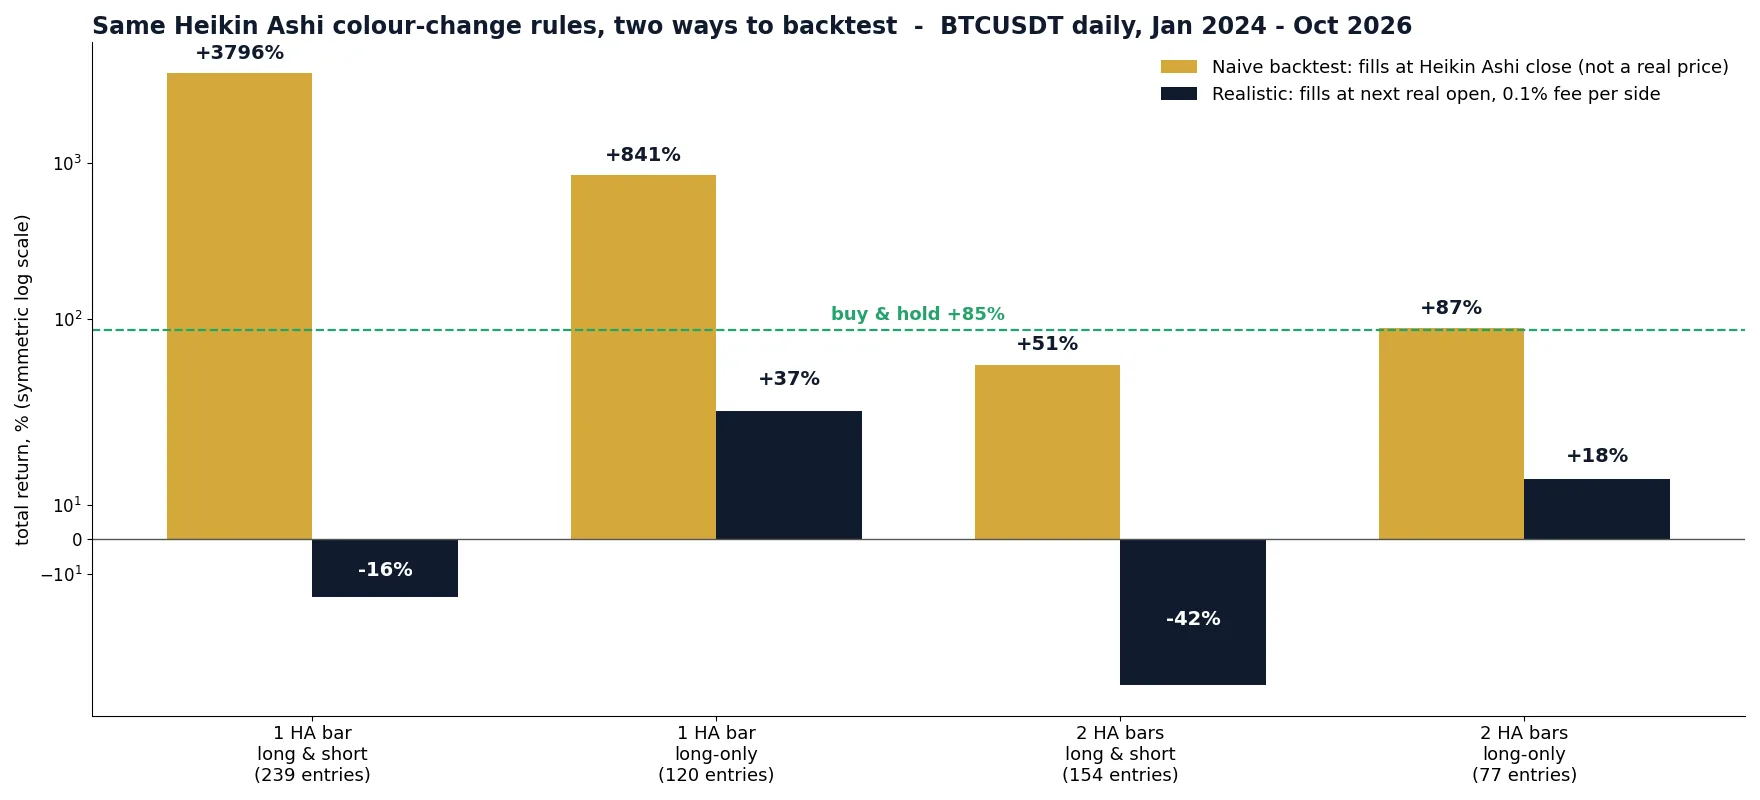
上記テンプレートの単純な色転換ルールを、同じ BTCUSDT 日足データで2通りの方法で検証しました。1つは平均足の終値で約定させる方法(素朴な方法)、もう1つは現実的に、次の実際の始値で片道0.1%の手数料を加えて約定させる方法です。
| ルール(BTCUSDT 日足) | エントリー数 | 素朴:HA 終値で約定 | 現実的:次の実際の始値、手数料0.1% |
|---|---|---|---|
| 平均足1本、買いと売り | 239 | +3,796% | -16.5% |
| 平均足1本、買いのみ | 120 | +841% | +37.0% |
| 平均足2本、買いと売り | 154 | +51% | -42.0% |
| 平均足2本、買いのみ | 77 | +87% | +17.6% |
素朴なバックテストは、損失を出すシステムを驚異的なシステムに見せてしまいます。理由は単純です。平均足の終値は実際の終値より遅れるため、陽線の平均足の「終値で」現れたシグナルは、バックテスト上では実際の相場より低い価格で約定します。すべての取引に、現実にはあり得ない小さな割引が付き、数百回の取引でそれが数千パーセントに積み上がるのです。BTCUSDT の4時間足データ(2026年4月〜10月)でも同じ効果が見られました。買いと売りの両方を行うバージョンで、素朴な方法では +110%、現実的な方法では -40% でした。
実践的な結論は2つです。
- シグナルの生成には平均足を使い、バックテストは実際のチャートで行い、次の実際の価格で約定させる。
- 手数料とスリッページを含める。3年足らずで239回エントリーする戦略は、およそ478回手数料を支払います。
バックテストには実際に取引できたはずの価格を使わなければならないという原則は、あらゆる戦略に当てはまります。高速な戦略については、レイテンシー・アービトラージのバックテストが誤解を招く理由で詳しく説明しています。
自動売買における平均足
トレーディングロボットにおいて、平均足はトレンドフィルターまたは状態判定として役立ちます。「4時間足の平均足が陽線の間だけ買いポジションを建てる」というルールはコード化が簡単で、トレンドに逆らう取引を多く排除できます。一方、正確な価格やタイミングに依存するものには向いていません。
- レイテンシー・アービトラージや HFT には不向き。これらの戦略は生のティックとフィード間のミリ秒単位の差で成り立っています。平均化された足はその情報を捨ててしまいます。レイテンシー・アービトラージの仕組みと、高頻度 FX 取引の概要をご覧ください。
- 損切りや利確には不向き。注文は実際の価格で執行されるため、水準も実際の価格から計算する必要があります。
- 現在の足には注意。確定した平均足は変化しませんが、形成中の足はティックごとに変化します。確定した足でのみ判断してください。
ロボットを開発または購入する場合は、アルゴリズム・自動 FX 取引のガイドでインフラ面を解説しています。また、非アービトラージ型 FX ロボットでは、トレンド系やグリッド系システムのリスクを説明しています。
エントリー前チェックリスト
- トレンドの方向を、上位の時間足または実際の価格に基づくフィルターで確認した。
- 同じ色の平均足が1本だけでなく2本出ている。
- 損切りを実際のチャート上に置き、そのストップからポジションサイズを計算した。
- 相場はトレンド状態であり、レンジ内で上下していない。
- 戦略は手数料とスリッページを含め、実際の価格でバックテスト済みである。
2ページの平均足チートシート(PDF、英語版)には、計算式、ローソク足シグナル、戦略テンプレート、チェックリスト、本記事のバックテスト表が収録されています。
無料アービトラージスキャナー+短いメール講座
無料スキャナーのリンクと、Boris からの短く実践的なメールをお届けします。コスト差し引き後の価格差が本当に意味すること、実際の資金を投じる前に戦略をテストする方法、あなたの市場に合うツールについて。誇張はありません。 メールは英語で配信されます。
よくある質問
平均足はデイトレードに向いていますか?
日中足のチャートでも使えますが、時間足が短いほど、各取引に占める手数料とスリッページの割合が大きくなり、ノイズによって足の色が切り替わる頻度も高くなります。当社の4時間足の検証では、単純な色転換システムはコスト控除後に損失となりました。平均足は、単独のスキャルピングシグナルとしてよりも、4時間足や日足でのフィルターとして使うほうがうまく機能する傾向があります。
平均足に最適な時間足は?
万能な最適解はありませんが、平均足によるトレンドフォローは通常、4時間足と日足でより安定します。よく使われるのは、上位の時間足でトレンドを読み、下位の時間足でエントリーのタイミングを計る方法です。
平均足はリペイントしますか?
確定した足は変化しません。形成中の足はティックごとに変化します。また、各 HA 始値はひとつ前の足に依存するため、異なる開始足から計算した値は、系列の冒頭でわずかに異なることがあります。確定した足と十分な履歴を使ってください。
平均足戦略はバックテストできますか?
できます。ただし、シグナルは平均足から生成し、注文は実際の価格(例えば次の実際の始値)で、手数料とスリッページを含めて約定させてください。上の表が示すとおり、平均足の価格で約定させると結果が大幅に水増しされます。
平均足と練行足(Renko)はどちらが良いですか?
どちらもノイズを減らします。練行足は時間を無視し、価格が一定幅動いたときだけブロックを描きます。平均足は時間軸を保ったまま各足を平均化します。平均足のほうが、時間ベースのインジケーターや複数の時間足と組み合わせやすいです。
平均足戦略の PDF はどこで入手できますか?
無料の平均足チートシート(PDF、英語版)をダウンロードしてください。実データによるバックテストを含め、本ガイドの内容を2ページにまとめています。
チャートの読み取りに頼らない戦略をお探しですか?
BJF Trading Group は、アービトラージと自動売買のためのソフトウェアを開発しています。暗号資産取引所間の価格差を検出する無料スキャナーから、FX と暗号資産に対応したマルチストラテジー取引プラットフォーム SharpTrader まで提供しています。
データ:Binance BTCUSDT 日足(2024年1月10日〜2026年10月4日、999本)および4時間足(2026年4月22日〜10月5日)。バックテストはスリッページをモデル化していない簡略化した例示であり、将来の結果を予測するものではありません。取引には損失のリスクが伴います。
