資金調達率アービトラージのリターン:ネットAPRと損益分岐点の計算方法 2026年07月15日 – Posted in: cryptoarbitrage software
資金調達率アービトラージのリターン:ネットAPR、手数料、損益分岐点の計算方法
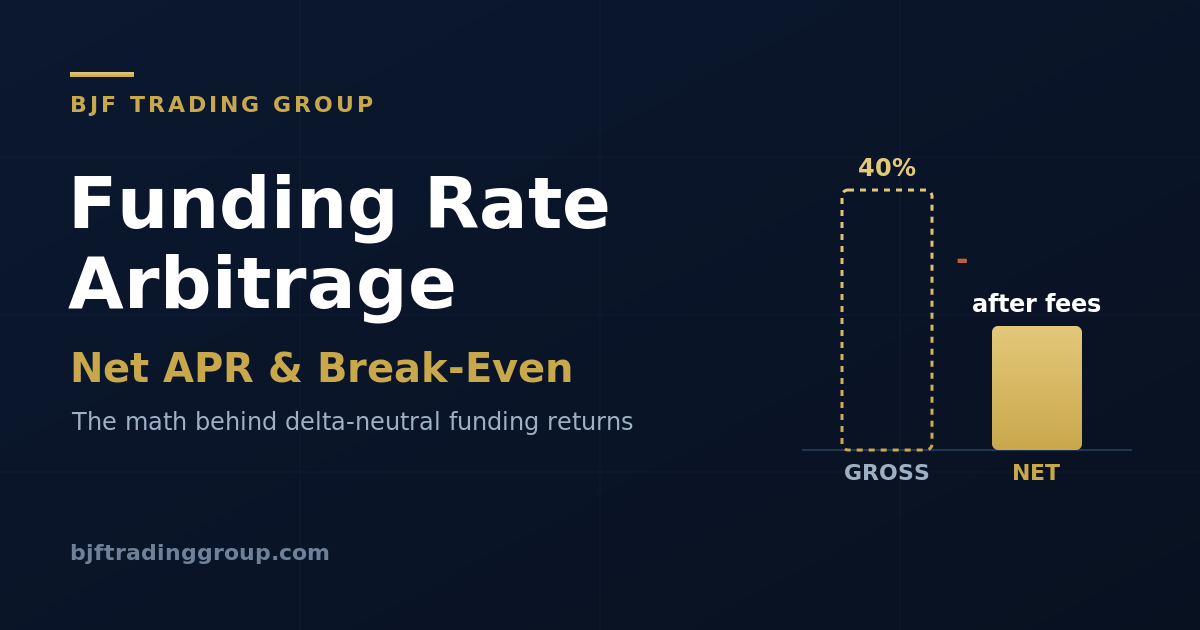
表面的な資金調達率がAPR 40%でも、損失になることがあります。このガイドでは、総コスト、損益分岐点の計算、ショート側のサイズ調整を、実例とインライン計算ツール付きで解説します。
資金調達率アービトラージに関する多くの記事は、グロスの数字で止まります。現在の資金調達率に年間のインターバル数を掛け、その結果を利回りとして提示します。しかし、その数字は出発点であって、実際のリターンではありません。その数字と実現利益の間にはコストの積み重ねがあり、さらに不都合な事実があります。資金調達率はインターバルごとに変わるため、エントリー時のレートがエグジット時のレートであることはほとんどありません。
この記事は、当社の資金調達率アービトラージガイドおよびライブスキャナーの数字重視の補足です。取引がどのように構築されるかをまだ読んでいない場合は、まずそちらから始めてください。ここでは、この戦略を実行する価値があるかを決めるひとつの問いに集中します。ネットリターンはいくらか、そして損益分岐点に達するには実際にどの資金調達率が必要なのか、という問いです。
まずはグロス資金調達APRから始める
無期限契約の資金調達率はインターバルごとに表示され、最も一般的には8時間ごと、つまり1日3回です。グロス年率は、現在のレートが変わらず続くと仮定します。
# Gross funding APR
intervals_per_day = 24 / interval_hours      # 8h -> 3
gross_APR = funding_rate_per_interval * intervals_per_day * 365

# Example: 0.01% per 8h
# gross_APR = 0.0001 * 3 * 365 = 0.1095 = 10.95% per year
この「レートが続く」という仮定こそ、最初に疑うべき点です。資金調達率は平均回帰します。今日レートが高いのは、ポジションが混み合っているからであり、混み合ったポジションはいずれ解消されます。グロスAPRは機会を比較するためのランキング指標として扱い、実際に回収できる金額の予測として扱わないでください。
グロスをネットに変えるコスト構造
資金調達アービトラージのポジションは、建てるときにも閉じるときにもコストがかかります。キャッシュ・アンド・キャリー構成(同じ資産のスポットをロングし、無期限契約をショートする)では、エントリー時に2つのレッグ、エグジット時にも2つのレッグで板を跨ぎます。重要なコストは次の通りです。
| コスト | 発生する場所 | 典型的な大きさ |
|---|---|---|
| 取引手数料 | 各レッグ、エントリーとエグジット | メイカー 0.01〜0.02%、テイカー 1約定あたり0.04〜0.10% |
| スリッページ | 各レッグ、薄いアルトでは悪化 | 1約定あたり0.01〜0.10%超 |
| スポット借入 | スポット側がレバレッジされている場合のみ | 変動し、資金調達の優位性を上回ることもある |
| 資金調達率の変動 | 保有するすべてのインターバル | レートは縮小したり反転したりする |
| リバランス | 片方のレッグに追加証拠金が必要な場合 | 追加約定、追加手数料 |
ネット優位性の式。 往復コストを、実際に保有するインターバル数に按分します。
# Round-trip cost as a percentage of notional
round_trip_cost = (fee_per_leg + slippage_per_leg) * 4      # 2 legs x open+close

# Net collected over a holding window of H intervals
gross_collected = funding_rate_per_interval * H
net_collected   = gross_collected - round_trip_cost

# Break-even: how many intervals just to cover entry+exit
break_even_intervals = round_trip_cost / funding_rate_per_interval
計算例1:単一取引所でのキャッシュ・アンド・キャリー
同じ取引所でBTCスポットをロングし、BTC無期限契約をショートします。資金調達率は8時間ごとに+0.01%なので、ショート側として受け取ります。両方のレッグでテイカー約定を想定します。
| インターバルごとの資金調達率 | +0.010% |
| グロスAPR (0.010% x 3 x 365) | 10.95% |
| レッグごとの手数料(テイカー) | 0.045% |
| レッグごとのスリッページ | 0.020% |
| 往復コスト ((0.045 + 0.020) x 4) | 0.260% |
| 損益分岐点 (0.260 / 0.010) | 26インターバル(約8.7日) |
落とし穴はすぐに見えます。8時間ごとに0.01%の場合、出入りのコストを回収するだけで約9日間保有する必要があります。1か月(約90インターバル)保有すると、ネットは0.90%から0.26%を差し引いた0.64%です。ただし、これを素直に年率換算できるのは、資金調達率がそのまま続く場合だけです。毎週ポジションを入れ替えると、手数料に食われます。だからこそ、資金調達アービトラージは忍耐を報い、過剰売買を罰します。また、メイカー注文を使ってレッグごとの手数料を0.045%からおよそ0.015%に下げることが、損益分岐点を半分以下にすることもあります。
計算例2:取引所間の資金調達スプレッド
同じ原資産、2つの取引所。取引所Aの資金調達率は8時間ごとに+0.040%、取引所Bは+0.005%です。Aで無期限契約をショート(0.040%を受け取る)し、Bで無期限契約をロング(0.005%を支払う)します。デルタニュートラル(片方のPerpをショートし、もう片方をロング)で、スプレッドを獲得します。
| インターバルごとのネット資金調達率 (0.040 – 0.005) | +0.035% |
| グロス・スプレッドAPR (0.035% x 3 x 365) | 38.3% |
| レッグごとの手数料(Perpテイカー) | 0.045% |
| レッグごとのスリッページ | 0.020% |
| 往復コスト ((0.045 + 0.020) x 4) | 0.260% |
| 損益分岐点 (0.260 / 0.035) | 約7.4インターバル(約2.5日) |
取引所間スプレッドは、インターバルごとの優位性が大きいため、損益分岐点にかなり早く到達します。問題は、これらのスプレッドもより速く縮小することです。どんな資本でも参入してスプレッドを閉じられるからです。また、2つの取引所口座、2つの証拠金枠、そして片方の取引所で出金停止や障害が起きると半分だけヘッジされた状態になるリスクも抱えます。優位性は大きいが、動く部品も多いということです。
損益分岐点となる資金調達率
問いを逆にしてみましょう。自分のコストと予定保有期間が分かっていれば、エントリーする価値がある最低資金調達率を計算できます。
# Minimum funding rate per interval to break even over H intervals
required_rate = round_trip_cost / H

# Cost 0.26%, planned hold 15 intervals (5 days):
# required_rate = 0.26 / 15 = 0.0173% per 8h
# Anything below that is a losing trade at your cost structure.
この一行こそ、戦略全体に必要な規律です。スキャナーを確認し、現実的な保有期間に対して必要レートを超えない行はすべて除外してください。テイカーコストで2日しか保有できない行の高APRは、多くの場合、損失です。
ネットAPR計算ツール
自分の数字を入力してください。計算ツールは、グロスAPR、損益分岐インターバル、そしてそのコスト構造で資金調達率が1年間続いた場合に残るネットAPRを表示します。
ラリーで清算されないようにショート側をサイズ調整する
資金調達アービトラージが失敗する最も一般的な理由は、実は資金調達率ではありません。急騰時に、スポット側の相殺利益を実現する前に、ショートの無期限契約側が清算されることです。紙の上でデルタニュートラルでも、実務上安全とは限りません。スポットと無期限契約は通常、別々の証拠金枠と別々の清算ロジックに置かれるからです。
- ショートの無期限契約は低い実効レバレッジに保ってください。2〜3倍レバレッジで資金調達された1:1ヘッジは、30〜40%の逆行にも耐えます。同じヘッジを10倍で行うと、通常のヒゲで清算されます。
- 可能であれば、スポット側がショートの担保になる統合証拠金またはポートフォリオ証拠金を選び、2つのレッグが別々に競争するのではなく、1つの口座内で相殺されるようにします。
- 証拠金の自動補充または部分的な巻き戻しを自動化し、清算価格そのものではなく、そのかなり手前にアラートを設定してください。
- 受け取る資金調達は小さいことを忘れないでください。1回の清算で何か月分もの収益が消えることがあります。証拠金バッファはコストではなく、戦略そのものです。
この取引で損失が出るよくある理由
- グロスだけを引用し、コスト構造を無視する。 APR 40%の行は、手数料、スリッページ、そして資金調達率が下がるほぼ確実な可能性を差し引く前の数字です。
- 薄い資金調達でテイカーとして出入りする。 損益分岐点が遠く、到達する前に退出してしまいます。
- ショート側の証拠金が不足している。 ヘッジが別の場所ではまだ有効でも、ヒゲで清算されます。
- インターバルの仮定を間違える。 一部の資産は4時間または1時間ごとに資金調達されます。それらを8時間として年率換算すると、APRを2倍以上に過大表示します。
- 最上位の行を追いかける。 最も高い資金調達率は、通常、スリッページが大きく、1インターバル内で反転する低流動性アルトにあります。
- 送金遅延を無視する。 取引所間構成では、担保を移動する時間はヘッジされていない時間です。
よくある質問
資金調達アービトラージ取引のネットリターンはどう計算しますか?
損益分岐点に必要な資金調達率はどれくらいですか?
メイカー注文とテイカー注文のどちらを使うべきですか?
高APRの取引だったのに、なぜ損失になったのですか?
資金調達率が高いほど、常に良い機会ですか?
BJFトレーディングリサーチを購読する
新しい記事、リサーチペーパー、製品リリースを、公開時にお届けします。
無料アービトラージスキャナー+短いメール講座
無料スキャナーのリンクと、Boris からの短く実践的なメールをお届けします。コスト差し引き後の価格差が本当に意味すること、実際の資金を投じる前に戦略をテストする方法、あなたの市場に合うツールについて。誇張はありません。 メールは英語で配信されます。
