Return Arbitrase Funding Rate: Cara Menghitung APR Bersih dan Break-Even Juli 15, 2026 – Posted in: cryptoarbitrage software
Return Arbitrase Funding Rate: Cara Menghitung APR Bersih, Biaya, dan Break-Even
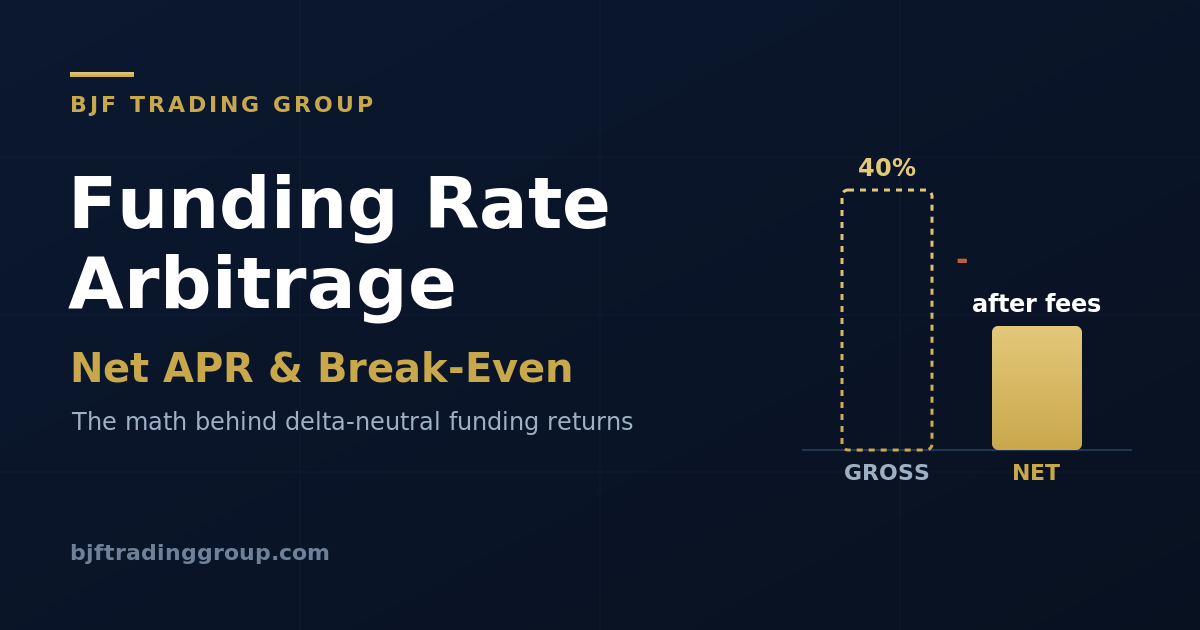
Funding rate headline sebesar APR 40% masih bisa merugi. Panduan ini menunjukkan seluruh struktur biaya, perhitungan break-even, dan cara menentukan ukuran posisi short, dengan contoh perhitungan dan kalkulator inline.
Sebagian besar tulisan tentang arbitrase funding rate berhenti pada angka kotor: mengambil funding rate saat ini, mengalikannya dengan jumlah interval dalam setahun, lalu menampilkan hasilnya sebagai yield. Angka itu adalah titik awal, bukan return. Di antara angka tersebut dan profit yang benar-benar Anda realisasikan terdapat tumpukan biaya dan satu fakta yang tidak nyaman: funding berubah setiap interval, sehingga rate saat Anda masuk jarang sama dengan rate saat Anda keluar.
Artikel ini adalah pendamping berbasis angka untuk panduan arbitrase funding rate dan scanner live kami. Jika Anda belum membaca bagaimana trade ini dibangun, mulai dari sana. Di sini kita fokus pada satu pertanyaan yang menentukan apakah strategi ini layak dijalankan sama sekali: berapa return bersihnya, dan funding rate apa yang benar-benar Anda butuhkan untuk mencapai break-even?
Mulai dengan APR funding kotor
Funding perpetual dikutip per interval, paling umum setiap 8 jam, yaitu tiga kali per hari. Rate tahunan kotor mengasumsikan rate saat ini bertahan tanpa perubahan:
# Gross funding APR
intervals_per_day = 24 / interval_hours      # 8h -> 3
gross_APR = funding_rate_per_interval * intervals_per_day * 365

# Example: 0.01% per 8h
# gross_APR = 0.0001 * 3 * 365 = 0.1095 = 10.95% per year
Asumsi persistensi adalah hal pertama yang perlu dicurigai. Funding cenderung kembali ke rata-ratanya. Rate yang tinggi hari ini tinggi karena positioning sedang padat, dan positioning yang padat akan terurai. Perlakukan APR kotor sebagai sinyal peringkat antar peluang, bukan sebagai proyeksi jumlah yang akan Anda kumpulkan.
Tumpukan biaya yang mengubah kotor menjadi bersih
Setiap posisi arbitrase funding membayar biaya untuk membuka dan membayar biaya untuk menutup. Dalam setup cash-and-carry (long spot, short perpetual untuk aset yang sama), Anda menyeberangi order book pada dua leg saat masuk dan dua leg saat keluar. Biaya yang penting:
| Biaya | Di mana terkena | Besaran umum |
|---|---|---|
| Biaya trading | Setiap leg, masuk dan keluar | Maker 0,01 hingga 0,02%, taker 0,04 hingga 0,10% per fill |
| Slippage | Setiap leg, lebih buruk pada alt yang tipis | 0,01 hingga 0,10%+ per fill |
| Pinjaman spot | Hanya jika leg spot menggunakan leverage | Bervariasi, bisa melebihi edge funding |
| Variansi funding | Setiap interval yang Anda tahan | Rate bisa menyempit atau berbalik |
| Rebalancing | Saat satu leg perlu tambahan margin | Fill tambahan, biaya tambahan |
Formula edge bersih. Amortisasi biaya round-trip atas jumlah interval yang benar-benar Anda tahan:
# Round-trip cost as a percentage of notional
round_trip_cost = (fee_per_leg + slippage_per_leg) * 4      # 2 legs x open+close

# Net collected over a holding window of H intervals
gross_collected = funding_rate_per_interval * H
net_collected   = gross_collected - round_trip_cost

# Break-even: how many intervals just to cover entry+exit
break_even_intervals = round_trip_cost / funding_rate_per_interval
Contoh perhitungan 1: cash-and-carry di satu venue
Long spot BTC, short perpetual BTC di exchange yang sama. Funding adalah +0,01% per 8 jam, jadi sebagai short Anda menerimanya. Asumsikan fill taker pada kedua leg.
| Funding per interval | +0.010% |
| APR kotor (0.010% x 3 x 365) | 10.95% |
| Biaya per leg (taker) | 0.045% |
| Slippage per leg | 0.020% |
| Biaya round-trip ((0.045 + 0.020) x 4) | 0.260% |
| Break-even (0.260 / 0.010) | 26 interval (~8,7 hari) |
Jebakannya langsung terlihat. Pada 0,01% per 8 jam, Anda harus menahan posisi sekitar sembilan hari hanya untuk menutup biaya masuk dan keluar. Tahan selama sebulan (sekitar 90 interval), dan bersihnya adalah 0,90% dikurangi 0,26%, atau 0,64% untuk bulan tersebut, yang hanya bisa dianualisasikan dengan rapi jika funding tetap bertahan. Putar posisi setiap minggu dan biaya akan menghabisi Anda. Inilah mengapa arbitrase funding memberi imbalan pada kesabaran dan menghukum overtrading, dan mengapa menggunakan order maker (memotong biaya per leg dari 0,045% menjadi sekitar 0,015%) dapat memangkas break-even lebih dari setengah.
Contoh perhitungan 2: spread funding lintas exchange
Underlying yang sama, dua venue. Exchange A mendanai pada +0,040% per 8 jam, Exchange B pada +0,005%. Short perpetual di A (menerima 0,040%), long perpetual di B (membayar 0,005%). Anda delta-neutral (short satu perp, long lainnya) dan menangkap spread.
| Funding bersih per interval (0.040 – 0.005) | +0.035% |
| APR spread kotor (0.035% x 3 x 365) | 38.3% |
| Biaya per leg (perp taker) | 0.045% |
| Slippage per leg | 0.020% |
| Biaya round-trip ((0.045 + 0.020) x 4) | 0.260% |
| Break-even (0.260 / 0.035) | ~7,4 interval (~2,5 hari) |
Spread lintas exchange mencapai break-even jauh lebih cepat karena edge per interval lebih besar. Masalahnya, spread ini juga menyempit lebih cepat, karena modal apa pun bisa datang untuk menutupnya, dan kini Anda menanggung dua akun exchange, dua bucket margin, serta risiko bahwa pembekuan penarikan atau gangguan di satu venue membuat Anda setengah ter-hedge. Edge lebih lebar, bagian bergerak lebih banyak.
Funding rate break-even
Balik pertanyaannya. Jika Anda tahu biaya Anda dan berapa lama Anda berniat menahan, Anda dapat menghitung funding rate minimum yang layak untuk masuk:
# Minimum funding rate per interval to break even over H intervals
required_rate = round_trip_cost / H

# Cost 0.26%, planned hold 15 intervals (5 days):
# required_rate = 0.26 / 15 = 0.0173% per 8h
# Anything below that is a losing trade at your cost structure.
Satu baris ini adalah disiplin yang dibutuhkan seluruh strategi. Saring scanner, lalu tolak setiap baris yang funding-nya tidak melewati rate yang Anda butuhkan untuk jendela penahanan yang realistis. APR tinggi pada baris yang hanya bisa Anda tahan dua hari, dengan biaya taker, sering kali adalah kerugian.
Kalkulator APR bersih
Masukkan angka Anda sendiri. Kalkulator menunjukkan APR kotor, interval break-even, dan APR bersih yang akan Anda pertahankan jika funding bertahan setahun penuh pada struktur biaya Anda.
Menentukan ukuran leg short agar rally tidak melikuidasi Anda
Cara paling umum arbitrase funding menjadi salah bukanlah funding itu sendiri. Melainkan likuidasi leg short perpetual saat rally tajam, sebelum keuntungan offset pada leg spot dapat direalisasikan. Delta-neutral di atas kertas tidak berarti aman dalam praktik, karena spot dan perpetual biasanya berada di bucket margin terpisah dengan logika likuidasi yang terpisah.
- Jaga short perpetual pada leverage efektif rendah. Hedge 1:1 yang didanai pada leverage 2 hingga 3x bertahan dari pergerakan merugikan 30 hingga 40%; hedge yang sama pada 10x dapat dilikuidasi oleh wick biasa.
- Pilih unified margin atau portfolio margin jika leg spot menjaminkan short, sehingga kedua leg saling mengimbangi di dalam satu akun, bukan saling berlomba.
- Otomatiskan top-up margin atau unwind parsial, dan pasang alert jauh sebelum harga likuidasi, bukan tepat di sana.
- Ingat bahwa funding yang Anda kumpulkan kecil; satu likuidasi bisa menghapus hasil berbulan-bulan. Buffer margin bukan biaya, melainkan strategi itu sendiri.
Cara umum trade ini kehilangan uang
- Mengutip angka kotor, mengabaikan tumpukan biaya. Baris APR 40% adalah 40% sebelum biaya, slippage, dan hampir pastinya funding turun.
- Masuk dan keluar sebagai taker pada funding tipis. Break-even panjang, dan Anda keluar sebelum melewatinya.
- Margin leg short terlalu kecil. Sebuah wick melikuidasi Anda sementara hedge Anda masih utuh di tempat lain.
- Asumsi interval yang salah. Beberapa aset funding setiap 4 jam atau 1 jam; menganualisasikannya sebagai 8 jam melebihkan APR hingga 2x atau lebih.
- Mengejar baris teratas. Funding tertinggi biasanya ada pada alt rendah likuiditas dengan slippage tebal yang berbalik dalam satu interval.
- Mengabaikan latensi transfer. Pada setup lintas exchange, waktu untuk memindahkan kolateral adalah waktu ketika Anda tidak ter-hedge.
Pertanyaan yang sering diajukan
Bagaimana cara menghitung return bersih pada trade arbitrase funding?
Funding rate apa yang saya butuhkan untuk break-even?
Haruskah saya menggunakan order maker atau taker?
Mengapa trade APR tinggi saya tetap merugi?
Apakah funding rate yang lebih tinggi selalu berarti peluang yang lebih baik?
Berlangganan riset trading BJF
Artikel baru, makalah riset, dan rilis produk, dikirim saat kami menerbitkannya.
Screening funding live dengan perhitungan yang tepat
Gunakan scanner funding live BJF untuk menemukan kandidat, lalu jalankan masing-masing melalui tes break-even di atas sebelum Anda mengalokasikan modal.
Scanner arbitrase gratis + kursus email singkat
Dapatkan tautan scanner gratis dan beberapa email singkat dan praktis dari Boris: arti sebenarnya selisih harga setelah biaya, cara menguji strategi sebelum mempertaruhkan uang sungguhan, dan alat mana yang cocok untuk pasar Anda. Tanpa janji berlebihan. Email dikirim dalam bahasa Inggris.
