Forex Liquidity Providers and Aggregators: How a Price Reaches Your Broker Tuesday November 10th, 2026 – Posted in: Arbitrage Software, Forex trading
Forex Liquidity Providers and Aggregators: How a Price Reaches Your Broker, and Why It Matters for Your Strategy
Every forex quote you see has travelled through a chain of banks, non-bank market makers, trading venues, prime brokers and aggregation engines before it reaches your broker’s server. Most guides on this topic are written for brokers who are shopping for liquidity. This one is written for traders: what each link in the chain does, how an aggregator builds the bid and ask you trade on, where the spread and markups come from, why two brokers show different prices at the same moment, and how to check the liquidity behind your own account.
- What a forex liquidity provider is
- The liquidity chain: from the interbank market to your screen
- Prime brokers and prime of prime
- How an aggregator builds the quote you trade on
- Markups, commissions and where your spread comes from
- More liquidity providers, tighter spread? The numbers
- Why two brokers show different prices at the same moment
- How fast a price travels: streams, conflation and lag
- Last look, rejections and the fill you actually get
- Step by step: checking the liquidity behind your account
- What it means for algorithmic and arbitrage traders
- Myths, risks and limitations
- FAQ
What a forex liquidity provider is
Short answer: a forex liquidity provider (LP) is a firm that continuously quotes prices at which it is ready to buy and sell currencies, and takes the other side of the trades it receives. Large dealing banks and non-bank electronic market makers are the main LPs. Retail brokers usually do not connect to them one by one: they access them through a prime broker or a prime-of-prime provider, and an aggregator combines several LP price streams into the single bid and ask you see. Which LPs are in that mix, how the aggregator works and how much markup is added explain most of the differences in spread, speed and fills between brokers.
The forex market has no central exchange. There is no single “real” EUR/USD price, only many dealers and venues quoting prices that are very close to each other most of the time. When you click buy on a retail account, the price you get comes from somewhere in that network, and the path it takes decides three things that matter to every strategy:
- Cost: the raw spread of the underlying liquidity plus whatever each intermediary adds.
- Speed: how many hops and processing stages the price passes before you see it, and whether updates are thinned out on the way.
- Fill quality: how much size is really available at the quoted price, and whether the provider can still reject your order after it arrives.
Liquidity providers are not the same thing as brokers. A broker is your counterparty or agent; an LP is a wholesale price source that sits behind the broker. Whether your broker passes your order to its LPs at all is a separate question (the A-book/B-book choice), covered in our guide to broker execution transparency. This article focuses on the price side: where the quote comes from and how it is built.
The liquidity chain: from the interbank market to your screen
It helps to think of forex liquidity as a set of layers. Each layer serves the one below it and needs credit, technology and minimum volumes from the one above.
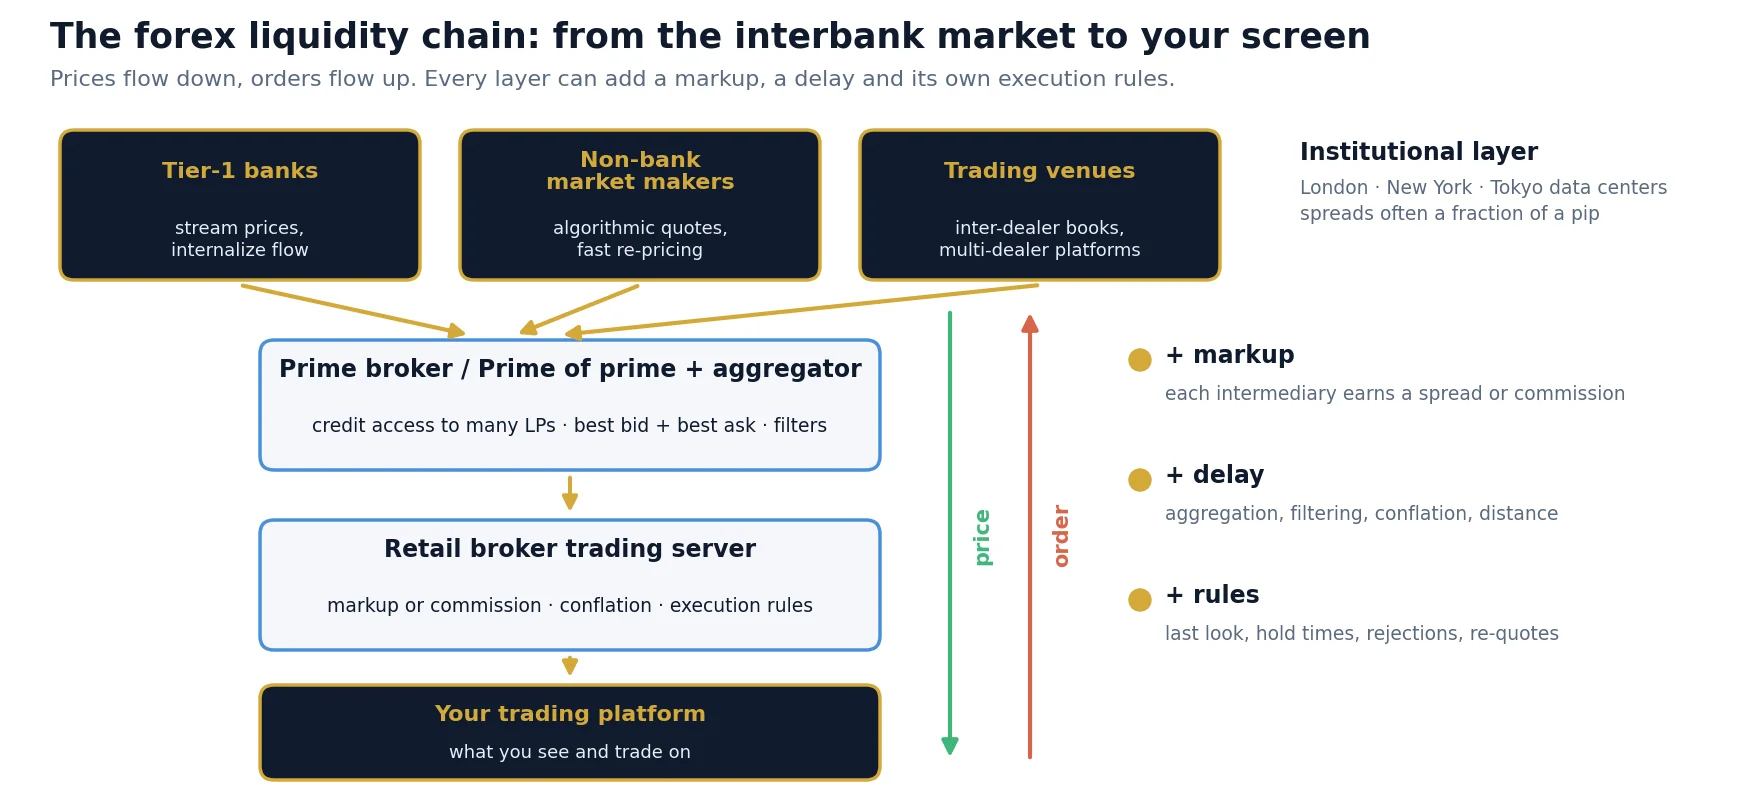
| Layer | Who is there | What it does | Who it serves |
|---|---|---|---|
| Tier-1 dealing banks | The largest global FX banks | Make markets in size, stream prices to clients, internalize flow, trade with each other | Institutions, funds, prime-broker clients |
| Non-bank market makers | Electronic trading firms that quote algorithmically | Stream tight prices to many venues and aggregators, often with very fast re-pricing | Venues, prime brokers, prime-of-prime providers, brokers |
| Trading venues (ECNs, multi-dealer platforms) | Primary inter-dealer venues and multi-dealer electronic platforms | Central order books or request-for-quote systems where many LPs meet | Banks, market makers, institutional clients |
| Prime brokers | Large banks offering prime brokerage | Lend their credit so a client can trade with many LPs under one agreement | Hedge funds, large brokers, prime-of-prime providers |
| Prime of prime (PoP) | Non-bank firms holding a prime brokerage relationship | Resell access to aggregated institutional liquidity in smaller sizes | Retail brokers, small funds, professional traders |
| Retail broker | Your broker | Receives one or more aggregated streams, applies markups and execution rules, decides how orders are handled | You |
Two things are worth noticing. First, the prices at the top are already very competitive: on major pairs, institutional quotes in normal hours are often a fraction of a pip wide. Second, the further down the chain you are, the more stages the price passes. Every stage is an opportunity for a markup, a delay or an extra rule about when an order can be refused.
Banks and non-bank market makers
For decades, liquidity meant banks. Today a large share of electronic FX liquidity comes from non-bank market makers that quote algorithmically across many venues at once. For traders the difference shows up in behaviour rather than in names: some providers stream very tight prices but re-price fast and reject orders that arrive after the market has moved; others quote slightly wider but fill more reliably. A good aggregation setup mixes both.
Primary venues and the reference price
Although there is no central exchange, the main inter-dealer venues act as a practical reference for the most traded pairs, and their matching engines sit in a few data centers, mainly in London, New York and Tokyo. LPs and fast market makers place their pricing engines next to these venues. This geography is the physical basis of latency arbitrage: a price move that starts there reaches distant or slow retail feeds later.
Prime brokers and prime of prime
To trade directly with many LPs you need a credit relationship with each of them, or one prime broker that guarantees your trades to all of them. Prime brokers are large banks, and they accept clients only with substantial capital and volume. Most retail brokers do not meet those thresholds, so they connect through a prime-of-prime provider: a firm that has its own prime brokerage account and resells access, in smaller sizes, to the liquidity behind it.
For the trader, the PoP layer is mostly invisible, but it has consequences:
- Another markup: the PoP earns either a spread markup or a commission per million traded, which the broker passes on.
- Another aggregation step: the PoP builds its own aggregated book from its LPs before the broker sees it, and the broker may aggregate several PoPs again.
- Its own execution rules: the PoP decides which LPs see which orders, and LPs may treat flow from a PoP differently from flow coming directly from a bank client.
- Location: the PoP’s servers are usually in the major forex data centers, so the broker’s own server location becomes the next important link.
Brokers that describe themselves as “ECN” or “STP” usually mean that client orders are passed on to such an aggregated liquidity pool rather than kept in-house. The labels are marketing terms and are used loosely, so they say little about the quality of the liquidity behind them. The checks later in this guide tell you more than the label does.
How an aggregator builds the quote you trade on
An aggregator (often part of the broker’s “bridge” between its trading server and its liquidity) receives price streams from several LPs, normalizes them and combines them into one order book. The best bid is the highest bid from any LP, the best ask is the lowest ask from any LP. That is why an aggregated quote is usually tighter than the quote of any single provider.
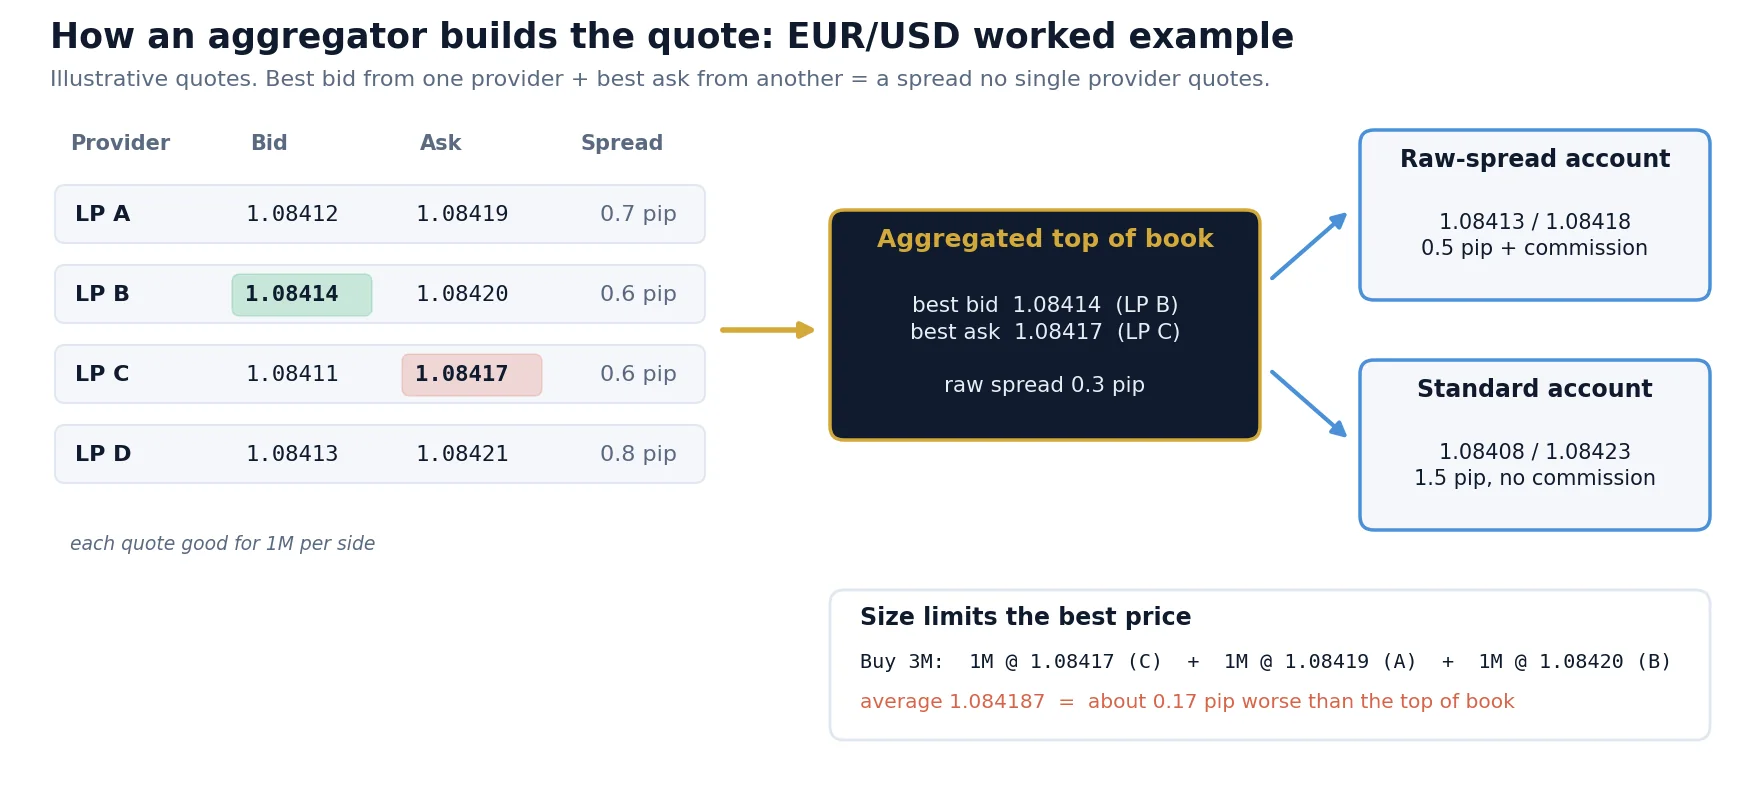
The example in the image uses four illustrative EUR/USD quotes, each good for 1 million euros:
| Provider | Bid | Ask | Own spread, pips | Size each side |
|---|---|---|---|---|
| LP A | 1.08412 | 1.08419 | 0.7 | 1M |
| LP B | 1.08414 | 1.08420 | 0.6 | 1M |
| LP C | 1.08411 | 1.08417 | 0.6 | 1M |
| LP D | 1.08413 | 1.08421 | 0.8 | 1M |
| Aggregated top of book | 1.08414 (B) | 1.08417 (C) | 0.3 | 1M each |
Three practical points follow from this simple picture.
1. The best price has limited size
The 0.3-pip aggregated spread exists only for the size shown at the top. A buy order for 3 million in this book would take 1M at 1.08417 (LP C), 1M at 1.08419 (LP A) and 1M at 1.08420 (LP B), for an average price of about 1.084187, roughly 0.17 pips worse than the top of book. For retail sizes this rarely matters on majors; on minor pairs, during rollover or in thin hours it can matter a lot. It is one reason why slippage grows with order size and with market conditions.
2. The order is split, and each part can be treated differently
When an order is larger than the best level, a sweeping aggregator splits it into child orders to several LPs. Each LP may fill, partially fill or reject its part. Some LPs require “full amount” orders (the whole size or nothing, at a price that already includes size), others accept sweeps. How the bridge handles a rejected child order, retrying at the next price, filling the rest elsewhere or returning a partial fill, decides what you see in your trade history.
3. Aggregated books can cross
Because providers re-price independently and at slightly different times, the best bid from one LP is occasionally higher than the best ask from another. A naive aggregator would show a negative spread. Real aggregators filter such “crossed” or “locked” states, drop stale quotes and may exclude an LP whose prices lag the others. These filters protect the broker, but they also add processing and can briefly hold back an update.
Markups, commissions and where your spread comes from
The spread on your screen is the raw aggregated spread plus every markup added on the way. The total can be charged as a wider spread, as a commission, or both. Using the same illustrative book:
Illustrative figures for EUR/USD with a pip value of $10 per standard lot. Real markups and commissions differ by broker, account type, pair and time of day.
In this example the raw account is cheaper per lot ($12 against $15). That is the usual pattern for active traders, but not a rule: a high commission on a raw account can cost more than a standard account at low volumes or on pairs with wide raw spreads. The right comparison is always the full round-turn cost per lot, measured on your own trades:
cost per lot = (average spread paid in pips x pip value) + round-turn commission + average slippage in pips x pip value
Spreads are not constant either. Aggregated spreads widen sharply around the daily rollover, during news and in thin hours, because LPs widen or pull their quotes at those times. We cover the mechanics and how to filter for them in why forex spreads widen.
More liquidity providers, tighter spread? The numbers
Brokers like to advertise how many LPs they connect to. More providers do tighten the aggregated spread, because the chance that one of them has the best bid and another the best ask rises with each stream. But the gain falls quickly, and every extra stream adds more crossed and stale states to filter.
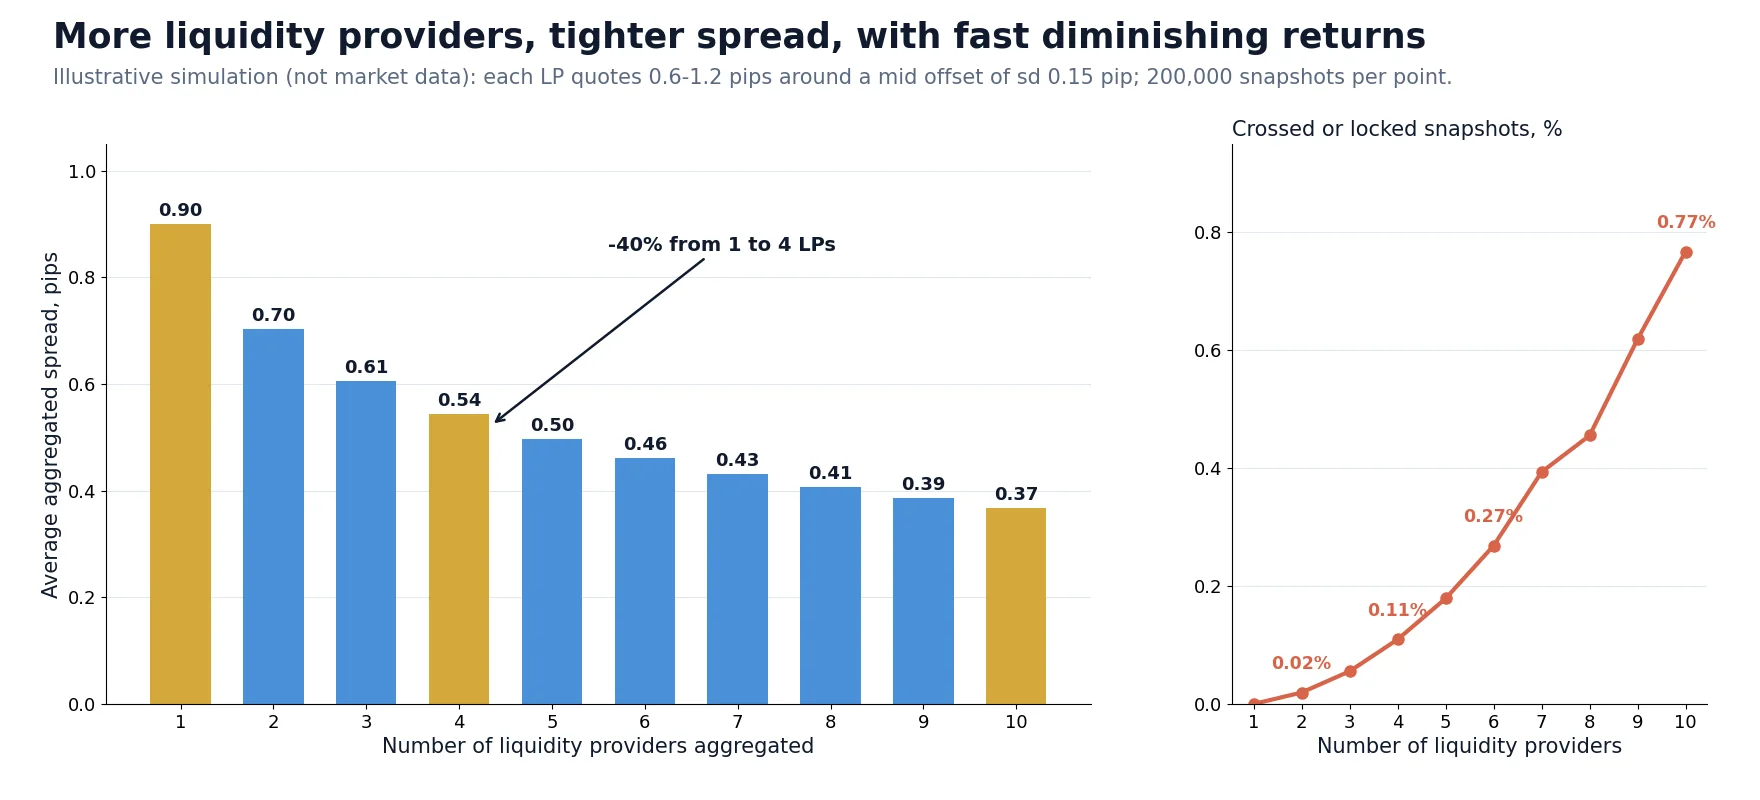
The simulation above gives each provider a spread between 0.6 and 1.2 pips and a small independent offset in its mid price (standard deviation 0.15 pips), then combines them as an aggregator would. Results over 200,000 snapshots:
| Number of LPs | Average aggregated spread, pips | Improvement vs one LP | Snapshots crossed or locked |
|---|---|---|---|
| 1 | 0.90 | – | 0% |
| 2 | 0.70 | 22% | 0.02% |
| 4 | 0.54 | 40% | 0.11% |
| 6 | 0.46 | 49% | 0.27% |
| 10 | 0.37 | 59% | 0.77% |
Going from one to four providers removes 40% of the spread in this model; going from six to ten removes only another 10 percentage points. In real markets the providers’ prices are strongly correlated, so the effect is usually smaller than in this idealized case. The practical lesson: the number of LPs is far less important than their quality, how fresh their quotes are and how the aggregator treats them. Two well-chosen, reliably filling providers can beat ten that quote tight and reject often.
Why two brokers show different prices at the same moment
Traders who put two brokers side by side notice that the quotes rarely match exactly, and sometimes one broker is consistently behind the other. With the liquidity chain in mind, the reasons are clear:
| Cause | What happens | Typical effect |
|---|---|---|
| Different LP mix | Each broker aggregates different providers through different PoPs | Small, changing differences in bid and ask |
| Different markups | Spread markups differ by broker and account type, sometimes asymmetrically | Constant offset or wider spread on one side |
| Aggregation and filtering | Stale-quote and crossed-book filters, LP exclusion rules | Brief delays or skipped updates |
| Conflation and throttling | The broker sends only the latest price every few milliseconds instead of every update | Fewer ticks, “jumps” in fast markets |
| Server location | The broker’s trading server is far from its liquidity or from you | Consistent lag behind faster feeds |
| Price smoothing or delayed feeds | Some trading setups deliberately smooth or delay prices | One feed visibly trails the market during moves |
Most of these differences are small and harmless. The last two are what latency arbitrage strategies detect and exploit: a broker feed that systematically trails a faster reference. If you want to see this on your own data, our guides on forex tick data and on comparing a fast data feed with broker prices show how to record both feeds and measure the lag.
How fast a price travels: streams, conflation and lag
A price move that starts at a primary venue or a large market maker reaches a retail platform after several processing and network stages. The figure below shows a typical order of magnitude for each stage. The exact numbers depend on the setup; the shape is what matters.
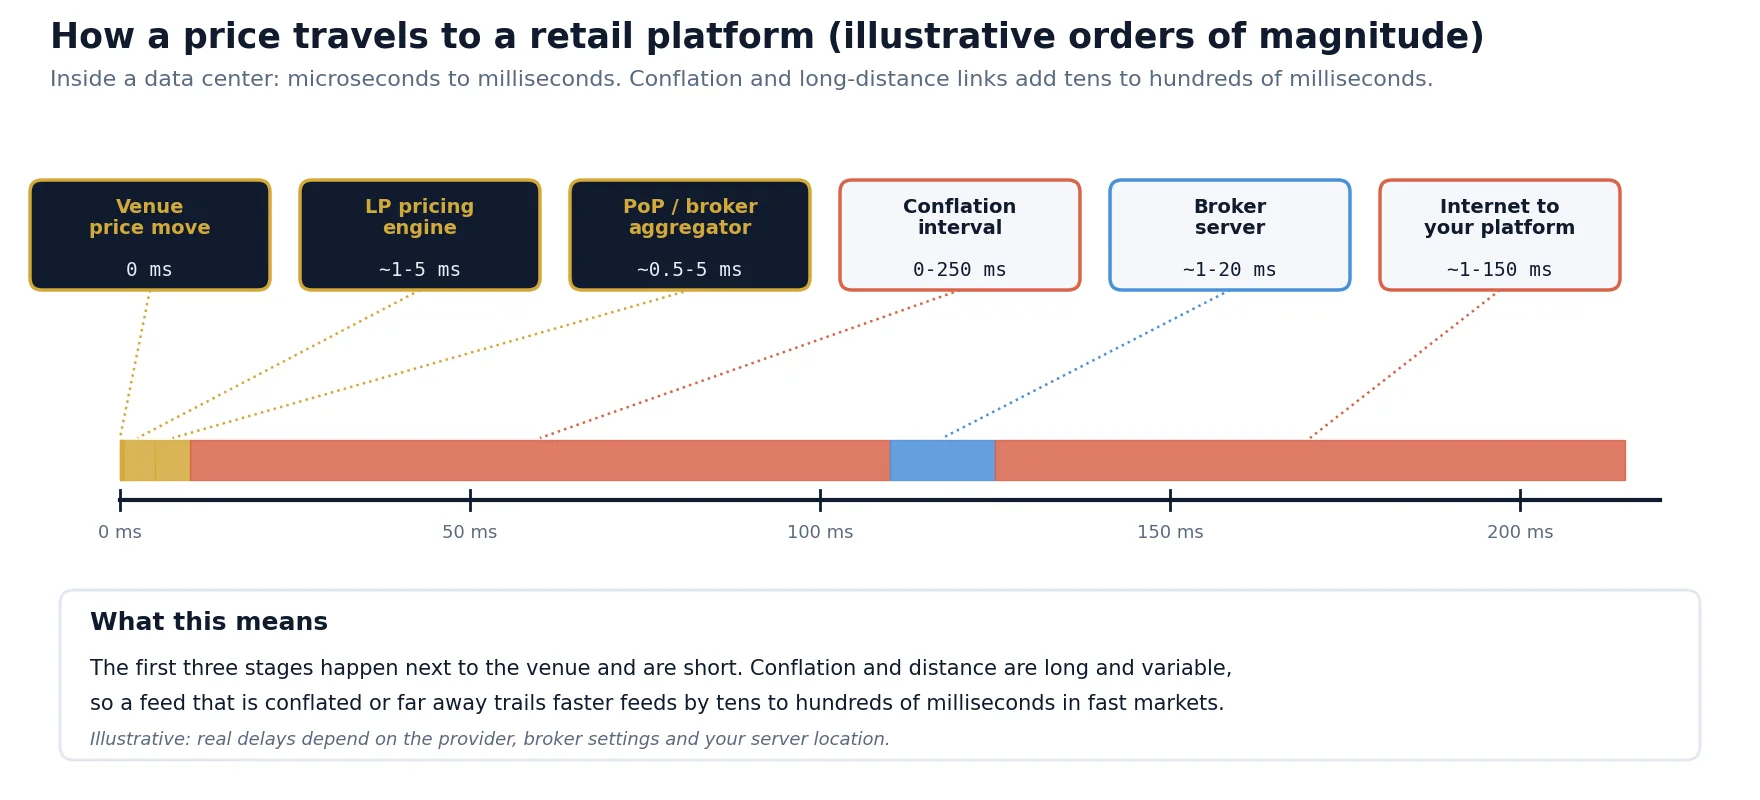
| Stage | Approximate added delay | Why |
|---|---|---|
| Venue to LP pricing engine (same data center) | Microseconds to about 1 ms | Cross-connects; LPs are colocated with major venues |
| LP re-pricing and stream publishing | About 1 to 5 ms | Internal risk and pricing logic, stream rate limits |
| PoP or broker aggregator | About 0.5 to 5 ms | Normalizing, filtering and merging streams |
| Conflation before the retail server | 0 to 250 ms or more | Only the latest price per interval is forwarded |
| Broker trading server processing | About 1 to 20 ms | Applying markups, symbol settings, distributing to clients |
| Internet to the trader | About 1 to 150 ms | Physical distance between your platform and the broker’s server |
The early stages are fast because they happen inside a few data centers. The large and variable numbers come from conflation and distance. That is why a professional trading setup puts the trading software on a server close to the broker, a topic we cover in choosing a VPS for arbitrage, and why direct institutional connections, such as a FIX API to a broker or PoP, are faster and more predictable than a retail platform connection.
What conflation does to your data
Conflation means that if a price changes ten times within one interval, only the last value is sent. Nothing is wrong with the price itself, but the path between updates is lost. For a trend strategy on hourly bars this is irrelevant. For a strategy that reacts to the first tick of a move, it decides whether the signal arrives in time. When you compare feeds, measure the number of updates per second as well as the lag: a feed with half as many ticks in fast markets is usually conflated.
Last look, rejections and the fill you actually get
A streamed quote is not always a firm promise. Many FX liquidity providers use last look: a short window after your order arrives in which they check whether the price is still valid and can reject it. Industry codes of conduct require providers to disclose how they use last look, and the window is usually measured in milliseconds, but the effect for fast strategies is clear: orders that would have been profitable because the market just moved are the ones most likely to be rejected or filled at a worse price.
Your broker may apply its own execution rules on top: minimum delays, re-quotes, asymmetric slippage or price checks. We explain how to detect these from your own trade logs in broker execution quality, and how A-book and B-book models change the picture in broker execution transparency. From the liquidity point of view, three numbers summarize what you actually get:
- Fill ratio: the share of orders filled without rejection or re-quote.
- Slippage distribution: how far fills land from the requested price, and whether positive slippage occurs as often as negative.
- Execution time: from order sent to fill confirmation, including any hold time.
Step by step: checking the liquidity behind your account
You cannot see your broker’s LP contracts, but you can measure the result. This is the routine we use when we evaluate a broker or an account type for an algorithmic strategy:
1
2
3
4
5
6
7
Steps 2 to 5 can be done without trading at all. A scanner that shows several feeds side by side, such as our free forex arbitrage scanner, is a quick way to see which feeds lead and which trail before you write any code.
What it means for algorithmic and arbitrage traders
Different strategies depend on different properties of the liquidity chain. Before choosing a broker or an account, decide which property your strategy actually needs:
| Strategy | Liquidity property that matters most | What to check |
|---|---|---|
| Swing and position trading | Total cost and swap rates | Average spread at your trading times, commission, overnight swaps |
| Intraday and scalping | Spread stability and fill ratio | 95th percentile spread, rejections, slippage symmetry |
| News trading | Behaviour when LPs pull quotes | Spread and fill quality in the first seconds after releases |
| Hedge (two-broker) arbitrage | Fill reliability on both legs and comparable costs | Fill ratio, execution time and cost per lot at both brokers |
| Latency arbitrage | Feed lag of the slow broker and its execution rules | Measured lag against a fast feed, last look and hold times |
| Statistical arbitrage and pairs trading | Cost on both instruments and spread during your holding period | Combined round-turn cost, behaviour at rollover |
For multi-broker strategies, the liquidity chain is the strategy. Two brokers fed by different PoPs, with different conflation and different execution rules, produce the price differences that arbitrage software looks for, and also the execution risks that decide whether those differences can be captured. Our guide to choosing forex arbitrage brokers covers broker selection in detail.
Myths, risks and limitations
- “More LPs means better execution.” Only up to a point. Beyond a handful of good providers, the spread gain is small and filtering problems grow.
- “ECN or STP means no conflict of interest.” These are marketing labels. Execution rules, markups and hybrid models still apply; measure fills instead of reading labels.
- “The aggregated price is the market price.” It is the best price from the providers your broker uses, at the moment the aggregator last updated, for the size at the top of the book.
- Liquidity disappears when you need it most. In news, rollover and flash moves LPs widen or withdraw quotes, and aggregated books become thin very quickly.
- Your measurements are local. Lag and fill tests reflect your server, your account and your time period. Repeat them after any change in broker infrastructure or account type.
- Terms and compliance. Brokers set their own rules about trading styles. Read your account agreement and use strategies that are allowed for your account.
Turn feed differences into a measurable strategy
SharpTrader connects to several brokers and fast data feeds at once, compares their prices in real time and executes arbitrage strategies with configurable filters for spread, slippage and execution time.
Free arbitrage scanner + short email course
Get the free scanner link and a few short, practical emails from Boris: what a price gap really means after costs, how to test a strategy before risking real money, and which tools fit your market. No hype.
FAQ
What is a liquidity provider in forex?
A forex liquidity provider is a bank or non-bank market maker that continuously quotes buy and sell prices and takes the other side of trades. Retail brokers usually access several liquidity providers through a prime broker or a prime-of-prime provider and combine their prices with an aggregator.
What is a liquidity aggregator?
A liquidity aggregator combines price streams from several liquidity providers into one order book. The best bid is the highest bid of any provider and the best ask is the lowest ask of any provider, so the aggregated spread is usually tighter than any single provider’s quote. It also routes and splits orders to the providers.
What is prime of prime in forex?
A prime-of-prime provider is a firm that holds a prime brokerage relationship with a large bank and resells access to institutional liquidity in smaller sizes. Most retail brokers connect to liquidity through prime-of-prime providers because they do not meet the capital and volume requirements of a bank prime broker.
Why do different forex brokers show different prices?
Because each broker uses a different mix of liquidity providers, different aggregation and filtering rules, different markups, different conflation settings and servers in different locations. Most differences are small, but a feed that consistently trails faster feeds indicates distance, conflation or smoothing.
Do more liquidity providers mean tighter spreads?
Yes, but with fast diminishing returns. In our illustrative model the average spread fell 40% from one to four providers and only about another 10 percentage points from six to ten. Quote freshness, fill reliability and execution rules matter more than the number of providers.
What is last look in forex?
Last look is a short window after an order reaches a liquidity provider in which the provider can check the price and reject the order. It protects providers from stale quotes, but it means fast strategies see more rejections or worse fills exactly when the market moves.
How can I check the liquidity quality of my broker?
Record the broker’s tick stream and a fast reference feed on the same machine, compare spreads, update rates and lag, then test small orders and record fill ratio, slippage and execution time. Combine spread, commission and slippage into one cost per lot to compare accounts.
This article is educational and does not constitute financial advice. Quotes, markups, costs, delays and the simulation in this article are illustrative examples and typical orders of magnitude, not measurements of any specific broker, liquidity provider or venue. Execution models and liquidity arrangements differ between brokers and change over time.
