 English
 Deutsch
 日本語
日本語 العربية
 한국어
한국어 Español
 Indonesia
 Tiếng Việt
 中文
中文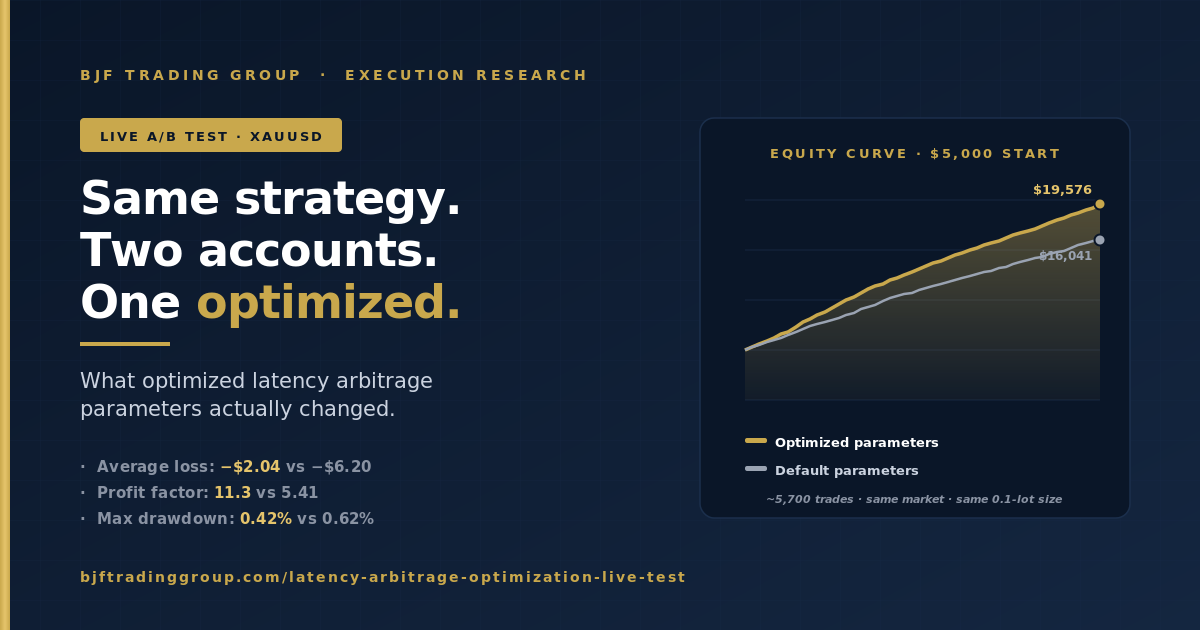
Same Strategy, Two Accounts: Optimized vs Default Latency Arbitrage on XAUUSD Segunda-feira, 22 de Junho de 2026 – Posted in: Arbitrage Software
BJF TRADING GROUP · SHARPTRADER OPTIMIZER
Same Strategy, Two Accounts: What Optimized Latency Arbitrage Parameters Actually Changed on XAUUSD
We ran the same latency arbitrage logic on two live accounts at the same time, same 1-lot size, same gold pair, same starting balance. One account used parameters tuned in the SharpTrader Optimizer. The other ran the defaults. Over roughly 5,700 trades the optimized account did not just earn more. It cut the average loss by two-thirds and doubled the profit factor. Here is the full breakdown.
Short answer: Optimizing latency arbitrage parameters did not chase a bigger profit per trade. It shrank the cost of losing trades. The optimized account’s average loss fell from −$6.20 to −$2.04, its average losing trade dropped from −6.2 pips to −2.0 pips, and its profit factor rose from 5.41 to 11.3. Net result over the test: $14,576 vs $11,041 in closed profit on a $5,000 base, with a lower maximum drawdown.
The result in one row
Both accounts started at $5,000 and traded the identical latency arbitrage entry logic on gold. The only difference was the parameter set: one came out of an optimization grid in the SharpTrader Optimizer, the other used the stock defaults. Here is the headline gap.
The profit gap is real, but it is the least interesting number on the page. A 32% higher net total over three sessions could be noise. What is not noise is how the optimized account got there, and that is the part worth reading.
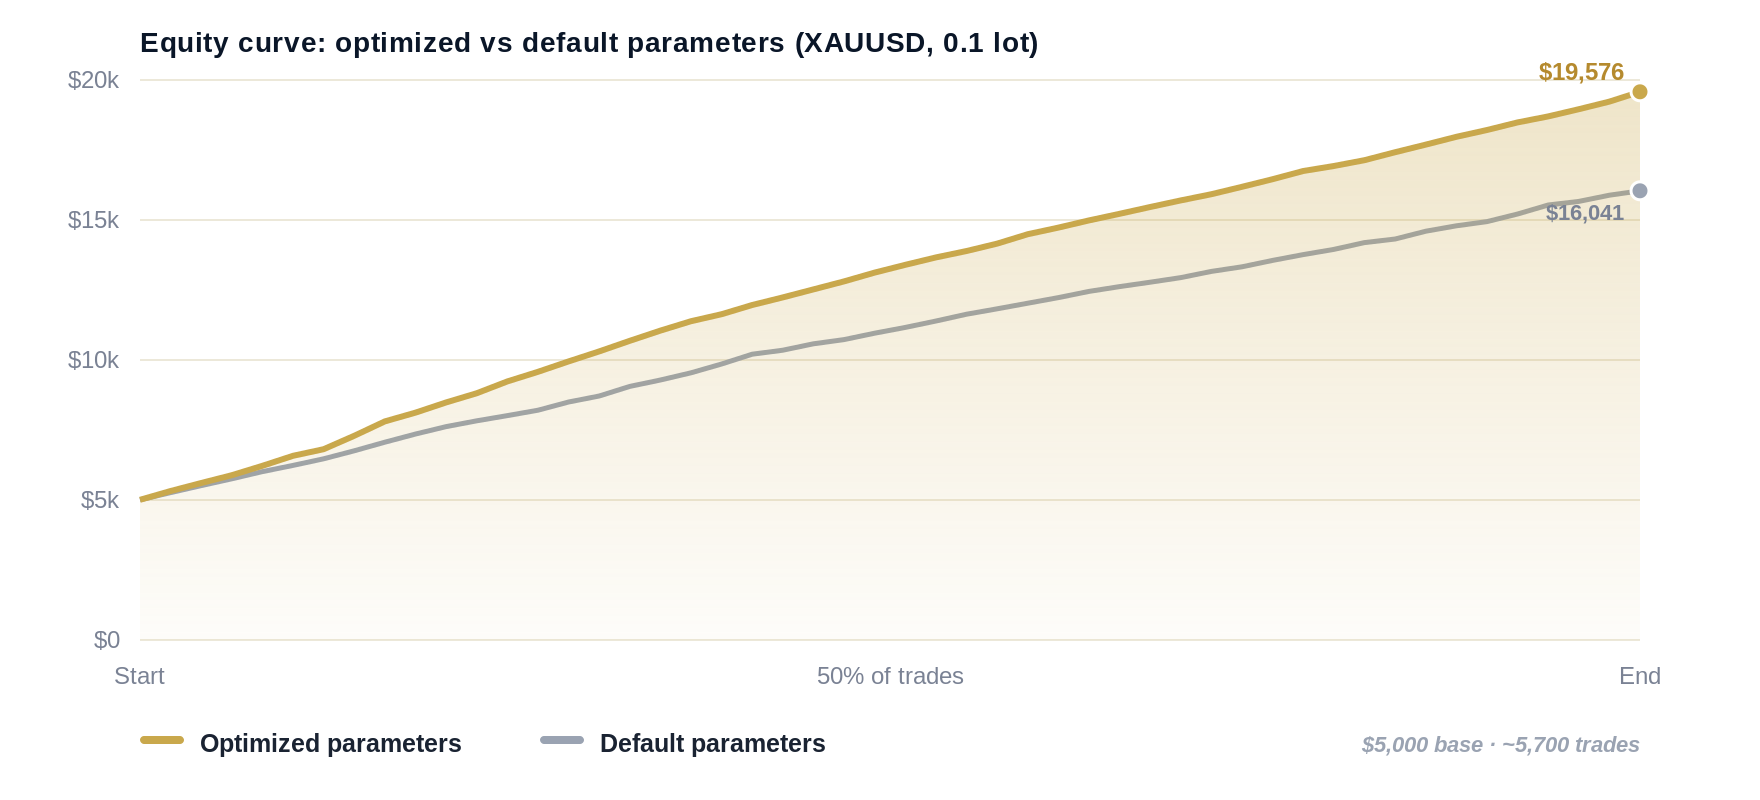
Two equity curves, side by side
Plotted against test progress (0 to 100% of closed trades), both curves climb steadily, which is what you expect from a working arbitrage edge. The optimized line pulls ahead gradually and finishes higher, with fewer and shallower dips along the way.
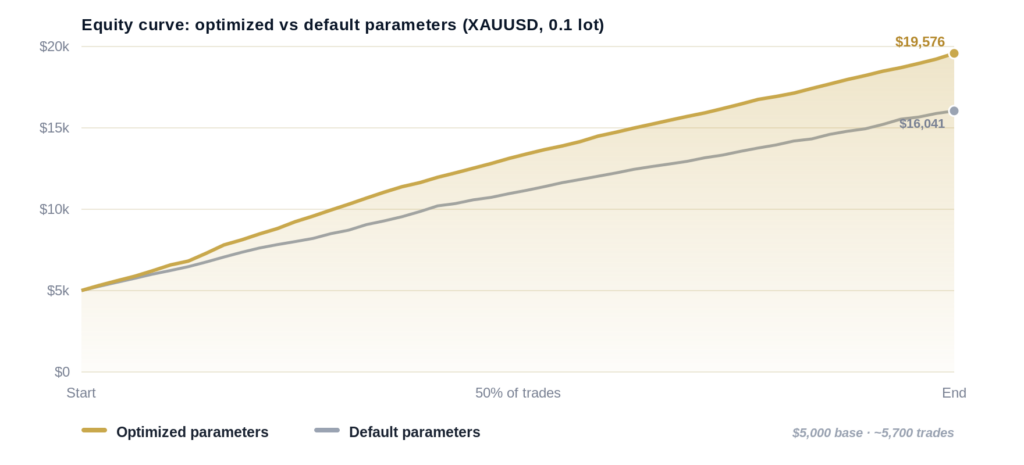
Closed-trade equity from a $5,000 base, normalized to test progress so the two trade counts (3,588 vs 2,149) line up for comparison.
The numbers in full
Read this table top to bottom. The story is not in the profit row. It is in the loss rows.
| Metric | Optimized | Default |
|---|---|---|
| Closed positions | 3,588 | 2,149 |
| Net closed profit | +$14,576 | +$11,041 |
| Win rate | 79.4% | 81.2% |
| Profit factor | 11.3 | 5.41 |
| Average win | +$5.61 | +$7.76 |
| Average loss | −$2.04 | −$6.20 |
| Average losing trade (pips) | −2.0 | −6.2 |
| Max drawdown | 0.42% | 0.62% |
| Max consecutive losses | 4 | 5 |
| Net profit std. dev. per trade | $5.83 | $7.12 |
| Avg. trade duration | 1.4 sec | 3.7 sec |
The counter-intuitive part
The optimized account had a lower win rate (79.4% vs 81.2%) and a smaller average win ($5.61 vs $7.76). On a naive scorecard it looks worse. Yet it made more money with less risk. Why? Because its losers were three times cheaper. In latency arbitrage your edge per trade is tiny and your enemy is the bad fill. Tighten the loss tail and everything downstream improves.
Why the loss tail is the whole game in latency arbitrage
A latency arbitrage signal lives for milliseconds. You are acting on a price that one venue has already moved to and another has not caught up to yet. When the fill is clean, you bank a few pips. When the fill is late, the price you wanted is gone and you are now holding the wrong side of a move that already happened. That is a slipped entry, and slipped entries are where the money leaks out.
Look at the default account’s average losing trade: −6.2 pips. That is not a strategy being wrong about direction. The win rate proves the direction read is fine, 81% of trades won. The −6.2 pips is execution cost: the gap between the price the signal fired on and the price the account actually got, plus the variable spread it paid crossing the book. The optimized account paid only −2.0 pips for the same kind of losing trade. Same edge, one third of the leakage.
What “optimization” meant here
- Tighter entry latency budget. The optimized set only acts when the modeled round-trip execution time fits inside the window where the arbitrage is still live. Stale signals are skipped instead of taken late.
- Spread-aware triggering. Entries are gated against the live variable spread, not a fixed assumption, so the account stops paying to cross a temporarily wide book.
- Faster exit handling. Average trade duration fell from 3.7 to 1.4 seconds. Positions are closed while the dislocation is still in your favor instead of held a beat too long.
- Higher selectivity, not higher aggression. The optimized account took more trades overall, but each one cleared a stricter execution-quality bar. Quantity went up because cheap, clean signals are plentiful once you stop taking the expensive ones.
How the test was run
Design: two live accounts, run in parallel over the same market sessions so both saw identical price action and identical liquidity conditions.
Controlled variables: same instrument (XAUUSD), same fixed lot size (1.0), same starting balance ($5,000), same broker conditions, same latency arbitrage core logic.
The single changed variable: the parameter set. Account A used values selected from a parameter grid in the SharpTrader Optimizer. Account B used the stock defaults.
Window: 19 to 22 June 2026. 3,588 closed positions on the optimized account, 2,149 on the default account.
Running both accounts at the same time is what makes the comparison fair. If you optimize on Monday and run the defaults on Tuesday, any difference might just be Monday versus Tuesday. Side by side, the market is a constant and the parameters are the only thing that can explain the gap.
How the optimizer found these parameters
The parameters did not come from guesswork or from curve-fitting a pretty equity line. They came from a grid search in the SharpTrader Optimizer, which is built to score execution-sensitive strategies the way the live market actually treats them. Four things make that search trustworthy for a latency strategy:
Real tick data
The search runs on actual historical tick streams, not on bar approximations. For a strategy that lives inside a single tick’s worth of dislocation, bar data hides the exact thing you are trying to capture.
Execution-time modeling
You set a realistic order execution latency in milliseconds and the optimizer shows how it changes results. Standard backtesters assume zero-latency fills, which is exactly the assumption that makes latency strategies look better on paper than in production.
Variable spread per tick
Historical spread is applied tick by tick, not as a fixed broker default. Entry and exit are each charged the spread that actually existed at that moment, so the −6.2 vs −2.0 pip difference shows up in testing before it costs you live.
Slippage on both legs
Open and close are modeled independently for slippage. A latency strategy can be slipped getting in or getting out, and the optimizer prices both, instead of assuming the exit is free.
On top of that, the grid runs across all CPU cores at high utilization, so a search over 100,000+ parameter combinations finishes in hours rather than days, and a 24-hour performance heatmap shows which trading hours actually carry the edge on gold. The parameters in this test are simply the best-scoring set once execution time, variable spread, and two-legged slippage were all charged honestly.
What to take from this if you trade latency arbitrage
- Stop optimizing for win rate. The worse-looking account on win rate made more money. Optimize for profit factor and average-loss size instead.
- Your losses are an execution metric, not a direction metric. When 80% of trades win, a −6 pip average loss is telling you about fills and spread, not about your signal. Fix it at the execution layer.
- Defaults are a starting point, never a finish line. The default set was profitable. It was also leaving roughly a third of the net on the table and carrying more drawdown to do it.
- Test with latency and variable spread switched on. Any backtest that assumes zero-latency fills and fixed spread will overstate a latency strategy and hide exactly the parameter that matters most.
Frequently asked questions
No. In this test the optimized account took more trades (3,588 vs 2,149) and still posted the higher profit factor (11.3 vs 5.41). The improvement came from cheaper losing trades, not from trading less.
Because profit is win rate multiplied by average win, minus loss rate multiplied by average loss. Cutting the average loss from −$6.20 to −$2.04 outweighed a slightly lower win rate and a smaller average win. The math rewards loss control more than it rewards a high hit rate.
Three days is short for judging absolute returns, which is why we lead with the structural metrics, not the dollar total. Over roughly 5,700 trades, differences in average loss, profit factor, and pip cost per losing trade are far more stable than the headline net figure. The dollar gap could shrink. The loss-tail gap is a property of the parameters.
The method transfers, but the parameters do not. Each instrument has its own spread behavior, volatility, and execution profile, so the grid search should be re-run per instrument. Gold was chosen here because its spread and tick behavior make execution cost easy to see.
The latency and spread thresholds that gate entries and exits, tuned against a parameter grid scored with real tick data, modeled execution time, variable spread per tick, and two-legged slippage. The core strategy logic was identical on both accounts.
Subscribe to BJF trading research
New execution studies, optimizer walkthroughs, and product releases – delivered when we publish them.
Run the same test on your own parameters
The SharpTrader Optimizer scores latency strategies with real tick data, modeled execution time, variable spread, and two-legged slippage, then hands you the parameter set that survives all four. Find the version of your strategy that holds up in production, not just on paper.