BJF TRADING GROUP · GUÍA DE ESTRATEGIA
Trading de pares en forex y arbitraje estadístico: cómo funciona en 2026
El trading de pares es la forma más antigua de arbitraje estadístico: operar el diferencial entre dos instrumentos históricamente vinculados cuando se desvía de su media, apostando por la reversión en lugar de la dirección. En forex tiene dos problemas difíciles que el trading de pares en acciones no tiene: las correlaciones pueden romperse de repente durante eventos de bancos centrales, y la calidad de ejecución del bróker decide si la ventaja por operación sobrevive a dos piernas simultáneas. Esta página cubre las matemáticas, la selección de pares candidatos, la capa de ejecución que la mayoría de traders minoristas nunca mide, y dónde la estrategia todavía funciona.
SharpTrader ejecuta la estrategia PairsTrading con Brent vs. BRN.Z4 y US30 vs. US30.Z4 en una sola cuenta, con un Z-index en M15 y periodo de 50 barras. Tras una breve explicación, se ve el programa operando durante dos días parciales.
- 0:08 — PairsTrading con pares muy correlacionados como EURCAD y USDCAD
- 0:27 — Instrumentos: Brent con BRN.Z4 y US30 con US30.Z4
- 0:45 — Usar dos cuentas si el bróker no ofrece futuros o índices
- 0:54 — Ajustes de correlación: Z-index, marco M15, periodo 50
- 1:11 — SharpTrader operando y sus estadísticas en dos días parciales
Configuración paso a paso de la estrategia de arbitraje estadístico en SharpTrader con una cuenta cTrader vía FIX API: mapeo de símbolos, horario, cálculo de lotes oro/plata, gestión de locks, stop loss, take profit e indicador de correlación.
- 0:12 — Añadir la estrategia de arbitraje estadístico y la lista de símbolos
- 2:18 — Elegir una sesión cTrader FIX API y mapear símbolos
- 3:52 — Definir horas de inicio y fin de trading para sesiones de índices
- 5:19 — Calcular el segundo lote a partir del primero (oro vs. plata)
- 6:23 — Gestión de locks y cierre forzado para evitar el triple swap
- 11:39 — Leer el indicador de correlación para entradas y salidas
Qué es realmente el trading de pares en forex
El trading de pares es una estrategia de arbitraje estadístico neutral al mercado: identificas dos instrumentos cuyos precios se mueven juntos por un motor económico compartido, construyes un diferencial entre ellos y operas ese diferencial cuando se desvía de forma anormal de su media histórica — largo en el rezagado, corto en el líder — apostando a que el diferencial revertirá. La posición no tiene una visión direccional; gana con el cierre de la brecha, no con la subida o bajada de ninguno de los instrumentos.
En acciones, un “par” son dos acciones del mismo sector. En forex, un par son dos pares de divisas — cuatro divisas en total — así que estás operando el diferencial de dos diferenciales. Cuando el dólar se fortalece, tanto EURUSD como GBPUSD caen; la relación entre ellos es mucho más estable que cualquiera de los dos pares por separado. El trading de pares aísla esa relación e ignora el dólar.
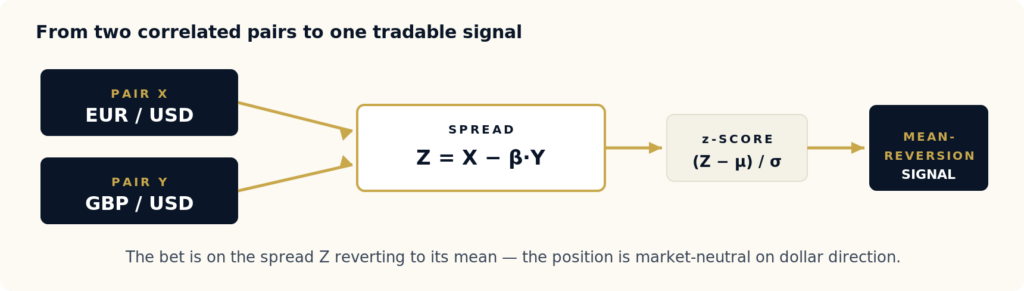
Figura 1 — Dos pares de divisas vinculados estructuralmente se combinan en un solo diferencial; su z-score impulsa una regla mecánica de entrada y salida.
El vínculo estructural es lo que hace viable la estrategia. Sin una razón económica para que dos pares se muevan juntos — divisa base compartida, exposición común a materias primas, régimen compartido de sentimiento de riesgo — una correlación histórica es una coincidencia, y se romperá la primera vez que sea sometida a estrés. El trading de pares forma parte de la familia más amplia de estrategias de arbitraje en forex; a diferencia del arbitraje de latencia o triangular, explota una ineficiencia estadística en lugar de una ineficiencia de precio o velocidad, por lo que tolera una ejecución más lenta, pero exige un control de riesgo mucho más riguroso.
El diferencial, la cointegración y el z-score
El punto de partida es la prueba de cointegración. Dos series de precios X e Y están cointegradas si existe una constante β tal que el diferencial Z = X − β·Y sea estacionario: tiene una media y una varianza estables en el tiempo, y las desviaciones revierten. La correlación por sí sola no basta: dos series pueden estar muy correlacionadas y aun así separarse de forma permanente. La cointegración es la propiedad más fuerte que realmente justifica una apuesta de reversión a la media.
El procedimiento estándar es el método de dos pasos de Engle-Granger: se regresa X sobre Y para estimar β, y luego se prueba la serie residual Z en busca de una raíz unitaria usando la prueba Augmented Dickey-Fuller (ADF). Si ADF rechaza la hipótesis nula de raíz unitaria (normalmente con p < 0.05), existe un diferencial con reversión a la media. A partir del diferencial calculas su z-score — cuántas desviaciones estándar se encuentra actualmente el diferencial respecto a su media — y lo operas.
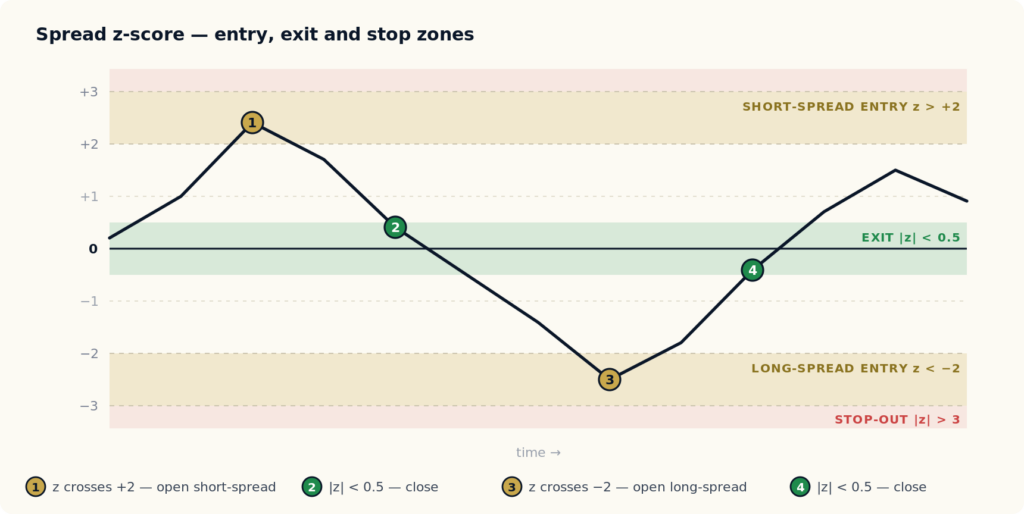
Figura 2 — La regla mecánica de trading. Se entra cuando el diferencial se extiende más allá de ±2 desviaciones estándar, se cierra cuando revierte hacia la media y se detiene más allá de ±3 (la relación se ha roto).
La regla es deliberadamente mecánica:
| Condición del z-score | Acción | Razonamiento |
|---|---|---|
| z < −2 | Entrar largo en el diferencial (comprar X, vender Y en proporción β) | El diferencial está anormalmente comprimido; se apuesta por una reversión al alza |
| z > +2 | Entrar corto en el diferencial (vender X, comprar Y) | El diferencial está anormalmente extendido; se apuesta por una reversión a la baja |
| |z| < 0.5 | Salir de la posición | El diferencial ha revertido; la ventaja ha sido capturada |
| |z| > 3 | Detener inmediatamente | La relación probablemente se ha roto: esto es cambio de régimen, no ruido |
Los umbrales de entrada ±2 y salida ±0.5 son convencionales, no derivados. En producción se optimizan por par con datos walk-forward, pero el patrón es el punto de partida universal. La parte difícil no es la regla; es asegurarse de que el diferencial esté realmente cointegrado y de que la capa de ejecución no se coma la ventaja.
Seleccionar pares candidatos que resistan en vivo
El enfoque ingenuo — escanear todas las combinaciones de símbolos líquidos de forex y conservar los más cointegrados — es la razón más común por la que las estrategias de pares funcionan en backtest y fallan en vivo. Con 35 principales y cruces hay 595 pares candidatos; con p < 0.05, aproximadamente 30 de ellos aparecerán como “cointegrados” por pura casualidad. Buscar cointegración mediante minería de datos encuentra esas coincidencias.
El enfoque robusto empieza por la estructura económica y usa los datos solo como filtro. Construye clústeres candidatos donde exista una razón real para el comovimiento, y luego prueba:
| Clúster | Pares de ejemplo | Vínculo económico |
|---|---|---|
| Región UE con base compartida | EURUSD vs GBPUSD | Ambas son divisas europeas denominadas en USD; responden juntas a regímenes de fortaleza del dólar |
| Exportadores de materias primas | AUDUSD vs NZDUSD | Ambas son divisas de materias primas del Pacífico, ambas expuestas a la demanda de China |
| Petrodivisas | USDCAD vs USDNOK | Ambas son economías exportadoras de petróleo en el lado de la divisa cotizada; el diferencial sigue la diferencia Canadá-Noruega |
| Clúster de carry / rendimiento | AUDJPY vs NZDJPY | Ambas reflejan diferenciales de rendimiento entre divisas de mayor tasa y Japón |
| Cohorte de refugio seguro | USDJPY vs USDCHF | Ambas responden al flujo global de aversión al riesgo, a distintas velocidades |
| Base compartida, cotización dividida | EURJPY vs EURUSD | Misma base (EUR); el diferencial es un proxy de la fuerza relativa del yen frente al dólar |
Confirmación en múltiples ventanas
Dentro de cada clúster, ejecuta la prueba de cointegración en ventanas móviles: 3 meses, 6 meses y 12 meses. Conserva solo los pares donde la prueba se mantenga en las tres ventanas. Un par que coin tegra durante 12 meses pero no durante 3 está en un régimen que ya está cambiando. La confirmación en múltiples ventanas es el filtro que mejor separa la cointegración real de la coincidencia específica de un régimen.
Riesgo de pierna: dónde la capa de ejecución destruye la ventaja
Esta es la parte que la mayoría de tutoriales de trading de pares omiten. Una señal de pares abre dos posiciones simultáneas. Si las dos piernas no se ejecutan en el mismo instante, quedas expuesto al riesgo de pierna: exposición direccional desnuda en el intervalo entre la primera ejecución y la segunda. En una estrategia que apunta a 0.5 a 1.0 pip de ventaja de reversión a la media por operación, incluso 200 ms de latencia entre piernas en un diferencial que se mueve rápido puede borrar la ventaja antes de que se ejecute la segunda pierna.
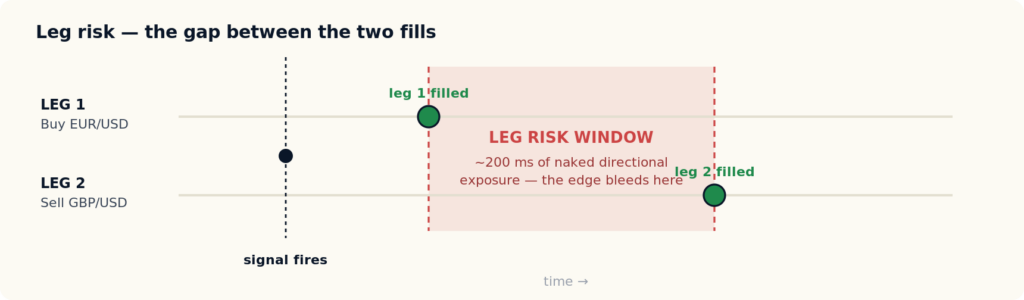
Figura 3 — Si las dos piernas no se ejecutan juntas, la posición queda direccionalmente expuesta durante la duración del intervalo. En una ventaja sub-pip, ese intervalo es la diferencia entre una estrategia rentable y una en punto de equilibrio.
Tres variables de ejecución deciden si el trading de pares sobrevive en producción, y ninguna aparece en las reseñas estándar de brókers:
- Latencia de emparejamiento entre las dos piernas. Si ambas piernas se enrutan por el mismo motor de matching, la latencia es simétrica y manejable. Los pares entre brókers — una pierna en el venue A, otra en el venue B — llevan un diferencial de latencia sin mitigar que la infraestructura minorista no puede cerrar.
- Asimetría del deslizamiento. Un bróker que ejecuta en contra del trader con más frecuencia que a favor grava tanto la entrada como la salida en ambas piernas: cuatro ejecuciones gravadas por ida y vuelta. En una ventaja sub-pip, esa asimetría por sí sola puede volver negativa la estrategia.
- Ampliación del spread en los momentos de señal. Las señales de pares se activan precisamente durante estrés de correlación, y los brókers amplían spreads exactamente en esos momentos. Una ampliación del spread del 30% en la señal se traduce directamente en un P&L por operación 30% menor.
Estas variables se pueden medir desde un extracto de trading, pero la mayoría de traders minoristas nunca las mide antes de desplegar capital. Publicamos una metodología y un conjunto de herramientas precisamente para esto: consulta el kit de auditoría de ejecución de brókers forex (BEQI), que puntúa la latencia de matching, la asimetría del deslizamiento y la ampliación del spread a partir de tu propio extracto. La misma brecha de tiempo de ejecución que rompe el arbitraje de latencia se aplica, en forma duplicada, al trading de pares: consulta por qué los backtests sensibles a la latencia no sobreviven en producción.
Cuándo funciona el trading de pares y cuándo no
La respuesta honesta para 2026 es que el trading de pares todavía funciona, pero solo dentro de condiciones estrechas. La estrategia no está muerta; la versión minada de datos sí lo está.
|
Funciona cuando Condiciones que mantienen intacta la ventaja
|
Falla cuando Condiciones que lo destruyen silenciosamente
|
En nuestra experiencia desplegando estrategias de arbitraje estadístico mediante venues minoristas de forex, el modo de fallo más común es la selección del bróker, no el diseño de la estrategia. Una estrategia de pares correctamente diseñada en un bróker de mala ejecución sigue perdiendo dinero; la misma estrategia en un venue rápido y simétrico todavía funciona. Mide el venue antes de confiar en el backtest: nuestra guía de brókers de arbitraje forex cubre qué buscar.
Trading de pares frente a otras familias de arbitraje
El trading de pares es una de las seis familias de estrategias de arbitraje forex. Cada una explota una ineficiencia distinta y exige una infraestructura diferente; entender dónde se ubica el trading de pares aclara qué requiere y qué no.
| Estrategia | Ineficiencia explotada | Sensibilidad a la latencia | Periodo típico de tenencia |
|---|---|---|---|
| Trading de pares | Estadística: desviación del diferencial respecto a la media | Baja a moderada | Horas a días |
| Arbitraje de latencia | Velocidad: una fuente más rápida frente a una cotización de bróker más lenta | Extrema | Milisegundos a segundos |
| Trading de noticias | Información: ventana de reacción tras una publicación | Extrema | Milisegundos a minutos |
| Arbitraje triangular | Precio: tasas cruzadas inconsistentes entre tres pares | Alta | Subsegundo |
| Arbitraje lock | Entre venues: posiciones compensadas entre brókers | Moderada | Minutos a días |
La conclusión: el trading de pares es el más tolerante a la latencia dentro de la familia de arbitraje, lo que lo hace accesible para traders sin infraestructura colocada. Pero esa tolerancia es relativa: el riesgo de pierna sigue importando, y la estrategia sustituye el riesgo de velocidad que domina el arbitraje de latencia y el trading de noticias por riesgo estadístico (ruptura de correlación). No necesitas ser el más rápido; necesitas ser el más disciplinado en la selección de pares y el riesgo de régimen.
Gestión del riesgo: cuando las correlaciones se rompen
El trading de pares funciona porque las correlaciones son estables. Deja de funcionar cuando las correlaciones se rompen, y se rompen de golpe, no gradualmente. Tres episodios que todo trader de pares debería modelar en su backtest:
- Banco Nacional Suizo, enero de 2015. Se abandonó el techo del CHF; EURCHF se movió aproximadamente un 30% en minutos. Todas las correlaciones de pares relacionados con CHF se rompieron simultáneamente.
- Aversión al riesgo por COVID, marzo de 2020. Las divisas de materias primas se desacoplaron entre sí cuando el flujo de aversión al riesgo superó los fundamentos relativos. El diferencial AUDUSD/NZDUSD, normalmente estable, se movió cuatro desviaciones estándar en dos sesiones.
- Cambios de régimen de política del Banco de Japón, 2022–2023. Todas las correlaciones de cruces JPY se reiniciaron dos veces en 18 meses. Los pares que funcionaron en 2021 perdieron dinero en 2023 con parámetros idénticos.
La respuesta de gestión de riesgo es estructural, no paramétrica: un stop duro en el momento en que |z| > 3 durante más de dos sesiones; tamaño de posición que escala de forma inversa a la proximidad de eventos importantes de bancos centrales; ninguna nueva entrada dentro de las 24 horas previas o posteriores a una publicación programada de alto impacto; y re-test walk-forward trimestral, retirando los pares que dejan de cointegrar en lugar de reoptimizarlos.
Una heurística práctica de dimensionamiento vincula el tamaño a la propia volatilidad del diferencial y a la distancia del stop:
# Tamaño de posición para trading de pares
position_size = (E × R) / (|β| × 3 × σ)

  E = capital de la cuenta
  R = riesgo por operación como fracción del capital (normalmente 0.5%–1%)
  β = coeficiente de cointegración (pendiente de regresión)
  σ = desviación estándar histórica del diferencial Z
  3 = umbral z de stop-out
El escalado por β mantiene las dos piernas neutrales en valor, no neutrales en contratos. Para carteras multipar, limita el nocional total de todos los pares abiertos y restringe las posiciones simultáneas a un puñado de relaciones de cointegración distintas; más allá de eso no estás diversificando, estás concentrándote en cualquier factor común que conecte los pares.
Probar estrategias de pares bajo ejecución realista
La razón por la que los backtests de pares sobreestiman la ventaja en vivo es que los probadores de estrategia estándar asumen ejecuciones con latencia cero y spread fijo: los dos supuestos que el riesgo de pierna y la ampliación del spread en el momento de la señal violan. Una estrategia de pares debe probarse bajo condiciones que incluyan ambos.
SharpTrader Optimizer fue creado para esto. Hace backtests sobre flujos históricos reales de ticks en lugar de aproximaciones por barras, te permite establecer un tiempo de ejecución de orden realista en milisegundos y ver cómo cambia los resultados, y aplica el spread histórico variable por tick, con deslizamiento modelado de forma independiente en la apertura y el cierre de cada pierna. Para una estrategia de dos piernas, eso significa que el backtest refleja la ventana de riesgo de pierna y la ampliación del spread en el momento de señal que describen las Figuras 2 y 3, en lugar de fingir que no existen. Un mapa de calor de rendimiento de 24 horas también muestra en qué horas de trading el diferencial de un par determinado revierte con mayor limpieza.
La versión corta
- El trading de pares explota una ineficiencia estadística: la reversión del diferencial a la media, y es neutral al mercado en dirección.
- Selecciona pares desde la estructura económica, confirma cointegración en ventanas de 3/6/12 meses y nunca mines datos.
- La ventaja es sub-pip, por lo que la calidad de ejecución decide la supervivencia: riesgo de pierna, asimetría del deslizamiento y ampliación del spread deben medirse.
- Las correlaciones se rompen de golpe: dimensiona para eventos de cola, detén firmemente en |z| > 3 y evita ventanas de calendario de bancos centrales.
- Haz backtests con tiempo de ejecución realista y spread variable, o la ventaja en vivo será 30–50% menor de lo que afirma el backtest.
Preguntas frecuentes
El trading de pares en forex es una estrategia neutral al mercado que opera el diferencial entre dos pares de divisas vinculados estructuralmente — cuatro divisas en total. Cuando el diferencial se desvía de forma anormal de su media histórica, compras el rezagado y vendes el líder, apostando a que el diferencial revierta. La posición no tiene una visión direccional sobre ninguna divisa individual; solo gana con el cierre de la brecha.
El trading de pares es la forma original y más simple de arbitraje estadístico. El arbitraje estadístico es la categoría más amplia: cualquier estrategia que explota una relación estadística entre instrumentos, incluidas cestas multi-activo y modelos factoriales. El trading de pares es el caso de dos instrumentos: un diferencial, una relación de cointegración, un z-score.
Los mejores candidatos comparten un motor económico real: EURUSD y GBPUSD (exposición compartida al dólar), AUDUSD y NZDUSD (exportadores de materias primas del Pacífico), USDCAD y USDNOK (petrodivisas), AUDJPY y NZDJPY (clúster de carry/rendimiento). Evita pares seleccionados solo porque un backtest dice que cointegran: con 595 combinaciones posibles, aproximadamente 30 aparecerán como cointegradas solo por azar.
Sí, pero solo dentro de condiciones estrechas: pares justificados económicamente, un venue de ejecución rápido y simétrico, tamaño de posición que respete el riesgo de cambio de régimen y validación walk-forward trimestral. La versión minada de datos del trading de pares no funciona; en realidad nunca lo hizo, solo parecía funcionar en backtest. La versión disciplinada sigue siendo viable.
El riesgo de pierna es la exposición direccional desnuda entre el momento en que se ejecuta la primera pierna de una operación de par y el momento en que se ejecuta la segunda. Una señal de pares abre dos posiciones que deberían ser simultáneas; cualquier brecha de latencia entre ellas deja la cuenta expuesta direccionalmente. En una estrategia que apunta a una ventaja sub-pip, incluso 200 ms de latencia de pierna en un diferencial que se mueve rápido puede borrar la ventaja antes de que la segunda pierna confirme.
Por cuatro razones: cointegración espuria por selección de pares mediante minería de datos; deslizamiento acumulado en cuatro ejecuciones por ida y vuelta; ampliación del spread en momentos de señal que los backtests de spread fijo ignoran; y eventos de ruptura de correlación (2015, 2020, 2022–2023) excluidos de la ventana de prueba. Juntos pueden hacer que la ventaja en vivo sea 30–50% menor que el backtest, o negativa.
El arbitraje de latencia explota una ineficiencia de velocidad — una fuente de precios más rápida frente a una cotización de bróker más lenta — y es extremadamente sensible a la latencia, manteniendo posiciones durante milisegundos. El trading de pares explota una ineficiencia estadística — reversión del diferencial a la media — mantiene posiciones durante horas a días y es mucho más tolerante a la latencia. El trading de pares sustituye el riesgo estadístico (ruptura de correlación) por el riesgo de velocidad que domina el arbitraje de latencia.
Usa un probador que trabaje con datos reales de ticks, permita establecer un tiempo de ejecución de orden distinto de cero y aplique spread histórico variable con deslizamiento modelado de forma independiente en la apertura y cierre de cada pierna. Los probadores estándar asumen ejecuciones con latencia cero y spread fijo: los dos supuestos que violan el riesgo de pierna y la ampliación del spread en el momento de señal. SharpTrader Optimizer fue creado específicamente para modelar esas variables.
Suscríbete a la investigación de trading de BJF
Nuevos artículos, papers de investigación y lanzamientos de productos, entregados cuando los publicamos.
Prueba tu estrategia de pares antes de arriesgar capital
Una estrategia de pares que parece rentable en un backtest con latencia cero y spread fijo puede quedar en punto de equilibrio en vivo. SharpTrader Optimizer hace backtests con datos reales de ticks, tiempo de ejecución configurable y spread variable — con deslizamiento modelado en ambas piernas, apertura y cierre — para que el resultado refleje el riesgo de pierna en lugar de ocultarlo.
Explorar SharpTrader Optimizer
Audita la ejecución de tu bróker