 English
 Deutsch
 日本語
日本語 한국어
한국어 Español
 Português
 Indonesia
 Tiếng Việt
 中文
中文
فهم المراجحة الإحصائية: طريق نحو التداول المربح 21/06/2023 – Posted in: Arbitrage Software, cryptoarbitrage software – Tags: arbitrage software, forex arbitrage, statistical arbitrage, statistical arbitrage bot, statistical arbitrage software
المراجحة الإحصائية (Statistical Arbitrage)، والتي يُشار إليها غالبًا باسم “Stat Arb”، هي استراتيجية تداول كمي شائعة تُستخدم على نطاق واسع من قبل صناديق التحوط وشركات التداول الاحترافي. تقوم الفكرة الأساسية على استغلال حالات عدم الكفاءة السعرية بين الأدوات المالية المرتبطة ببعضها. ويعتمد المتداولون الذين يستخدمون هذه الاستراتيجية على نماذج رياضية معقدة لاكتشاف فرص التداول، مما يجعلها جزءًا أساسيًا من التداول الخوارزمي.
نشأة المراجحة الإحصائية
تعود جذور المراجحة الإحصائية إلى ثمانينيات القرن الماضي، عندما طوّرها محللو وول ستريت الكميون المعروفون باسم “Quants”. في البداية، طُبّقت هذه الاستراتيجية في أسواق الأسهم، حيث تم اختيار أزواج الأسهم بناءً على خاصية التكامل المشترك (Cointegration)، وهي خاصية إحصائية تشير إلى أن الفجوة السعرية بين سهمين تميل إلى العودة إلى متوسطها على المدى الطويل. ومع مرور الوقت، تطورت هذه الاستراتيجية وتم تكييفها لاستخدامها في أسواق أخرى مثل الفوركس والعملات الرقمية.
المبدأ الأساسي
تعتمد المراجحة الإحصائية على مبدأ الارتداد إلى المتوسط (Mean Reversion) وقانون الأعداد الكبيرة. الفكرة الجوهرية هي أن الأسعار النسبية للأدوات المالية التي كانت مترابطة تاريخيًا ستعود بمرور الوقت إلى متوسطها. وهنا تحديدًا تظهر فرصة المراجحة الإحصائية، حيث يتم استغلال الانحرافات السعرية عن القيم التاريخية الطبيعية.
على سبيل المثال، إذا كان هناك سهمان يتحركان معًا تاريخيًا، ثم حدث تباعد بين أسعارهما — أحدهما ارتفع والآخر انخفض — فإن متداول المراجحة الإحصائية سيقوم ببيع السهم المتفوق على المكشوف وشراء السهم المتراجع، متوقعًا أن يتقارب “السبريد” بينهما مرة أخرى.
ما هو السبريد (Spread)
في المراجحة الإحصائية، يشير مصطلح “السبريد” عادةً إلى الفرق السعري أو التباين بين أداتين ماليتين مرتبطتين. قد تكون هاتان الأداتان سهمين، أو عقودًا آجلة، أو أزواج عملات في الفوركس، أو حتى عملات رقمية.
من الأمثلة الشائعة تداول الأزواج (Pair Trading)، حيث يتم تتبع السبريد بين سهمين كانا متكاملين إحصائيًا في الماضي. عندما ينحرف السبريد بشكل كبير عن متوسطه التاريخي، فإن ذلك يشير إلى فرصة تداول محتملة.
إذا اتسع السبريد بشكل مفرط، فهذا يعني أن أحد الأصول مُبالغ في تسعيره والآخر أقل من قيمته. في هذه الحالة، يقوم المتداول ببيع الأصل المُبالغ في تسعيره وشراء الأصل المُقوّم بأقل من قيمته. وإذا ضاق السبريد بشكل كبير، يتم تنفيذ العملية بالعكس.
من المفترض في المراجحة الإحصائية أن يكون السبريد قابلًا للعودة إلى المتوسط، أي أنه يتذبذب حول قيمة متوسطة طويلة الأجل. وعندما يبتعد السبريد كثيرًا عن هذا المتوسط، يتوقع المتداولون عودته، محققين الربح من هذه الحركة.

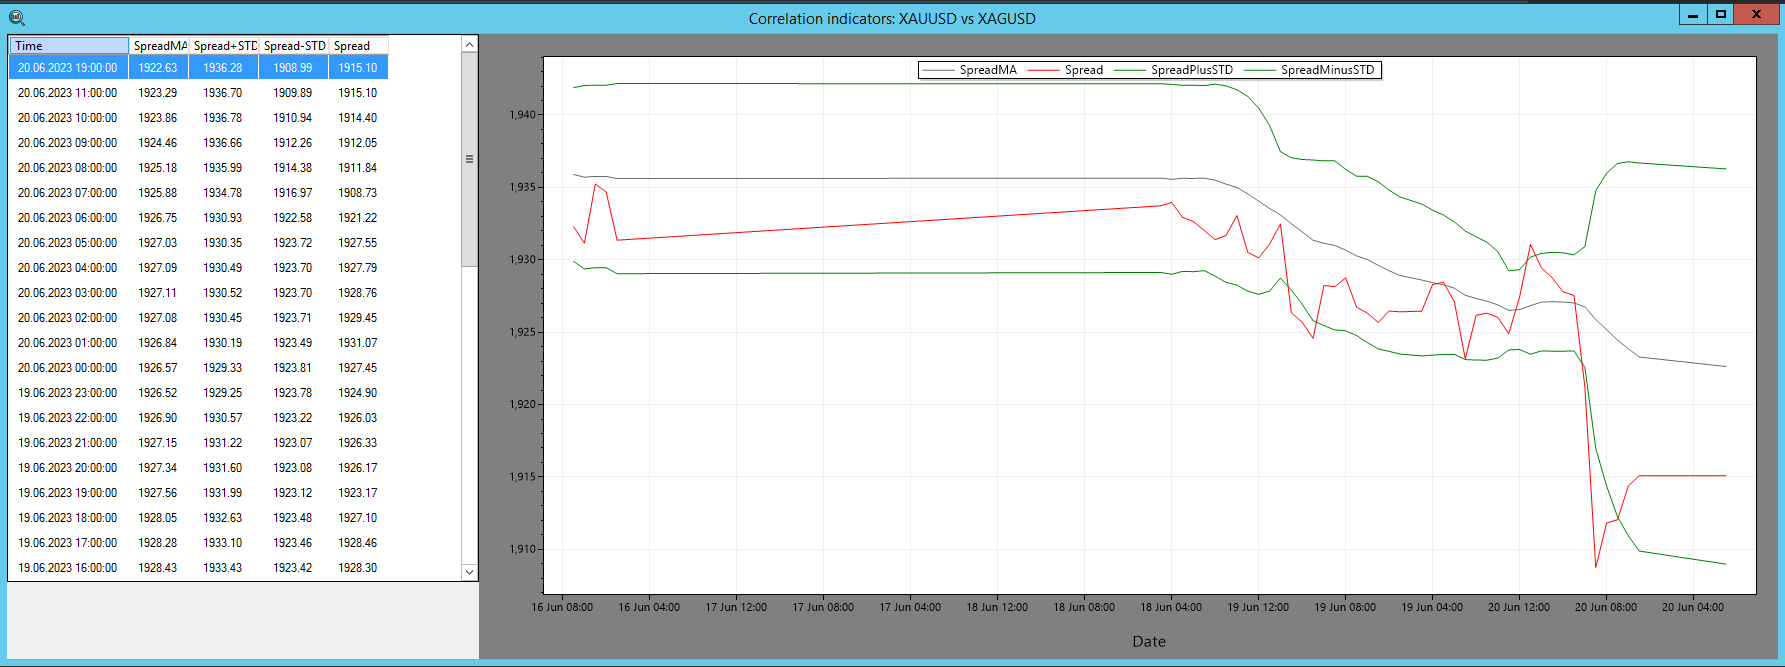
الصورة 1 – مؤشر السبريد في SharpTrader™
في برنامج SharpTrader™ للمراجحة، يُستخدم مؤشر السبريد لعرض العلاقة الارتباطية بين أصلين بشكل مرئي. ويتضمن حساب المؤشر العناصر التالية:
- السبريد: الفرق العددي بين قيم أصلين.
- SpreadMA: المتوسط المتحرك للسبريد خلال فترة زمنية محددة (pi_SpreadMA_Period).
- STD (الانحراف المعياري): الانحراف المعياري الكلاسيكي للسبريد بالنسبة إلى SpreadMA.
يتم فتح الصفقات وفقًا لمبادئ نظرية المراجحة الإحصائية.
نبذة نظرية عن حساب الارتباط
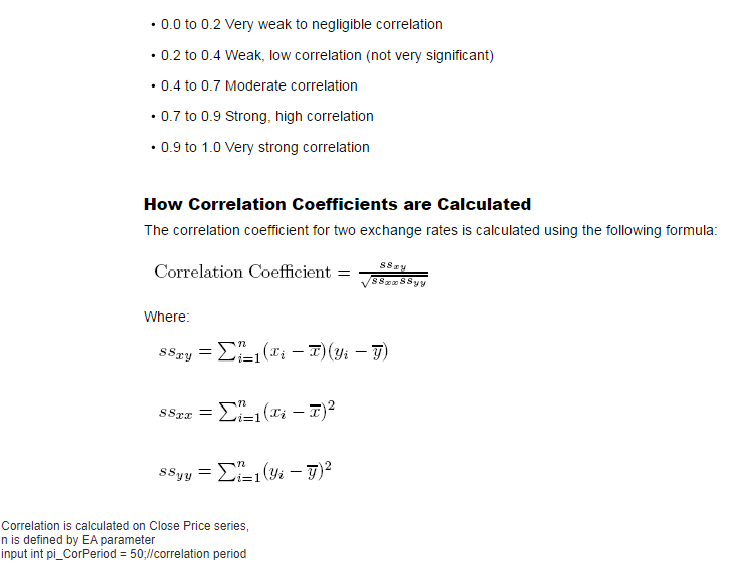
المراجحة الإحصائية – مصفوفة الارتباط
مصفوفة الارتباط هي جدول يُظهر معاملات الارتباط بين عدة متغيرات، حيث تتراوح القيم بين -1 و1.
الارتباط بقيمة 1 يعني ارتباطًا إيجابيًا تامًا، و-1 يعني ارتباطًا سلبيًا تامًا، بينما يشير الارتباط بقيمة 0 إلى عدم وجود علاقة بين المتغيرات.
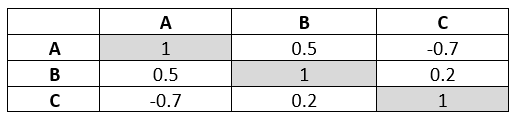
الصورة 2 – مثال على جدول الارتباط
تُستخدم مصفوفات الارتباط على نطاق واسع في المجال المالي لتحديد العلاقات بين الأصول، ودعم تنويع المحافظ الاستثمارية، وإدارة المخاطر.
تنفيذ استراتيجية المراجحة الإحصائية
يُعد تنفيذ المراجحة الإحصائية عملية معقدة تتطلب أدوات إحصائية متقدمة، وأنظمة حوسبة عالية السرعة، وخوارزميات متطورة. وتشمل العملية ما يلي:
- اختيار الأزواج: تحديد أزواج الأصول المرتبطة تاريخيًا باستخدام اختبارات إحصائية مثل التكامل المشترك.
- تحديد الحدود: وضع حدود علوية وسفلية للانحراف السعري.
- تنفيذ الصفقات: شراء الأصل الأقل أداءً وبيع الأصل الأفضل أداءً على المكشوف.
- الخروج من الصفقة: إغلاق المراكز عندما يعود السبريد إلى متوسطه.
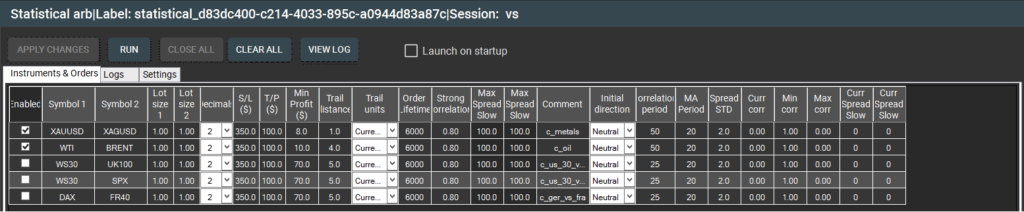
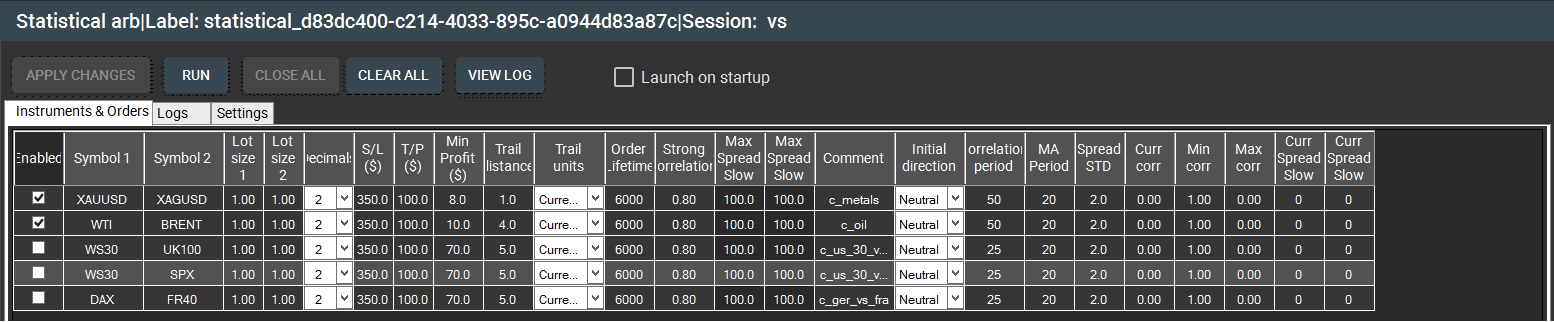
الصورة 3 – نافذة “الأدوات والأوامر” لاستراتيجية المراجحة الإحصائية في SharpTrader™

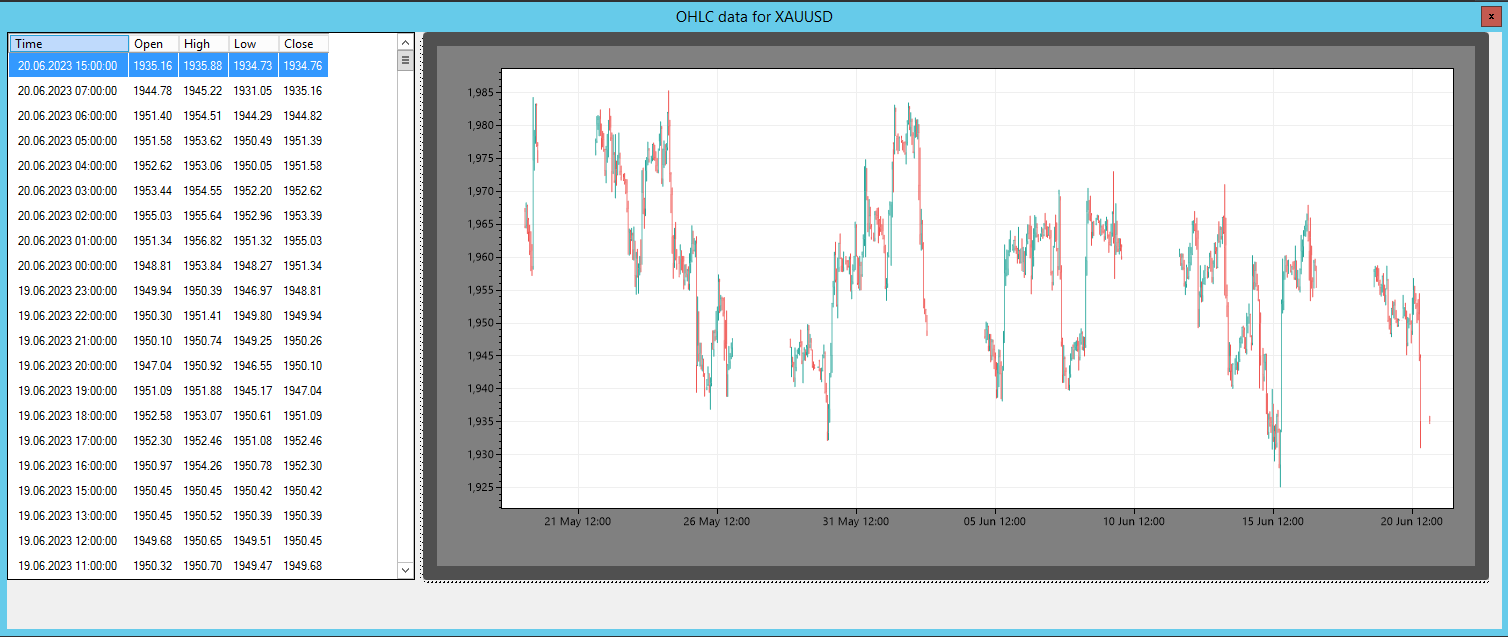
الصورة 4 – الرسوم البيانية والأسعار للمراجحة الإحصائية في SharpTrader™
المخاطر والقيود
مثل أي استراتيجية تداول، لا تخلو المراجحة الإحصائية من المخاطر. ومن أبرز هذه المخاطر “مخاطر النموذج”، أي احتمال اعتماد النماذج الرياضية على افتراضات غير صحيحة. إضافة إلى ذلك، يعتمد نجاح الاستراتيجية بشكل كبير على سرعة التنفيذ، حيث قد تختفي فرص عدم الكفاءة السعرية خلال أجزاء من الثانية.
مستقبل المراجحة الإحصائية
مع ازدياد كفاءة الأسواق المالية وأتمتتها، يكمن مستقبل المراجحة الإحصائية في تطوير خوارزميات أكثر تقدمًا، واستخدام التعلم الآلي والذكاء الاصطناعي. ومع استمرار الابتكار التكنولوجي، ستواصل المراجحة الإحصائية تطورها.
ختامًا، توفر المراجحة الإحصائية نهجًا متقدمًا تقنيًا في التداول يعتمد على نماذج رياضية معقدة وسرعة تنفيذ عالية. ورغم التحديات والمخاطر، تظل هذه الاستراتيجية جذابة نظرًا لإمكانية تحقيق أرباح مستقرة وبمستوى مخاطر منخفض نسبيًا عند تطبيقها بشكل احترافي.
