 English
 Deutsch
 العربية
 한국어
한국어 Español
 Português
 Indonesia
 Tiếng Việt
 中文
中文
統計的アービトラージを理解する:収益性の高い取引への道 2023年06月21日 – Posted in: Arbitrage Software, cryptoarbitrage software – Tags: arbitrage software, forex arbitrage, statistical arbitrage, statistical arbitrage bot, statistical arbitrage software
統計的アービトラージ(Statistical Arbitrage)は、一般に「スタット・アーブ(Stat Arb)」と呼ばれ、ヘッジファンドやプロップトレーディング会社によって広く利用されている代表的なクオンツ取引戦略です。その基本的な考え方は、相互に関連する金融商品間に存在する価格の非効率性を利用することにあります。スタット・アーブを活用するトレーダーは、複雑な数学モデルを用いて取引機会を特定しており、この戦略はアルゴリズム取引の一分野といえます。
統計的アービトラージの起源
統計的アービトラージは1980年代にウォール街の定量分析者、いわゆる「クオンツ」によって開発されました。当初は株式市場で利用され、2つの株式が共和分(コインテグレーション)しているかどうかに基づいてペアが選定されていました。これは、両銘柄の価格差が長期的に平均へ回帰する性質を持つことを示す統計的概念です。その後、この手法は進化し、現在ではFX市場や暗号資産市場にも応用されています。
基本原理
統計的アービトラージは「平均回帰(Mean Reversion)」と「大数の法則」に基づいています。過去に強い相関関係を持っていた金融商品の相対価格は、時間の経過とともに再び平均値へ戻るという考え方です。統計的アービトラージは、このような相関関係を持つ商品の価格が歴史的な水準から乖離した際に生じる歪みを利益機会として捉えます。
例えば、歴史的に同じ方向に動いてきた2つの株式があり、一方が上昇し、もう一方が下落した場合、統計的アービトラージでは上昇した株を空売りし、下落した株を買うことで、両者の価格差(スプレッド)が再び収束することに賭けます。
スプレッドとは何か
統計的アービトラージにおける「スプレッド」とは、2つの関連する金融商品間の価格差または乖離を指します。これは株式同士、先物契約、FX通貨ペア、さらには暗号資産同士である場合もあります。
代表的な例がペアトレードです。過去に共和分していた2銘柄のスプレッドが、その歴史的平均から大きく乖離した場合、それは取引チャンスを示します。
スプレッドが大きく拡大した場合、一方が割高、もう一方が割安であることを示唆します。その場合、割高な資産を売り、割安な資産を買います。逆にスプレッドが過度に縮小した場合は、反対のポジションを取ります。
統計的アービトラージでは、スプレッドは長期平均に回帰する性質を持つと想定されており、この回帰によって利益を得ることが目的です。

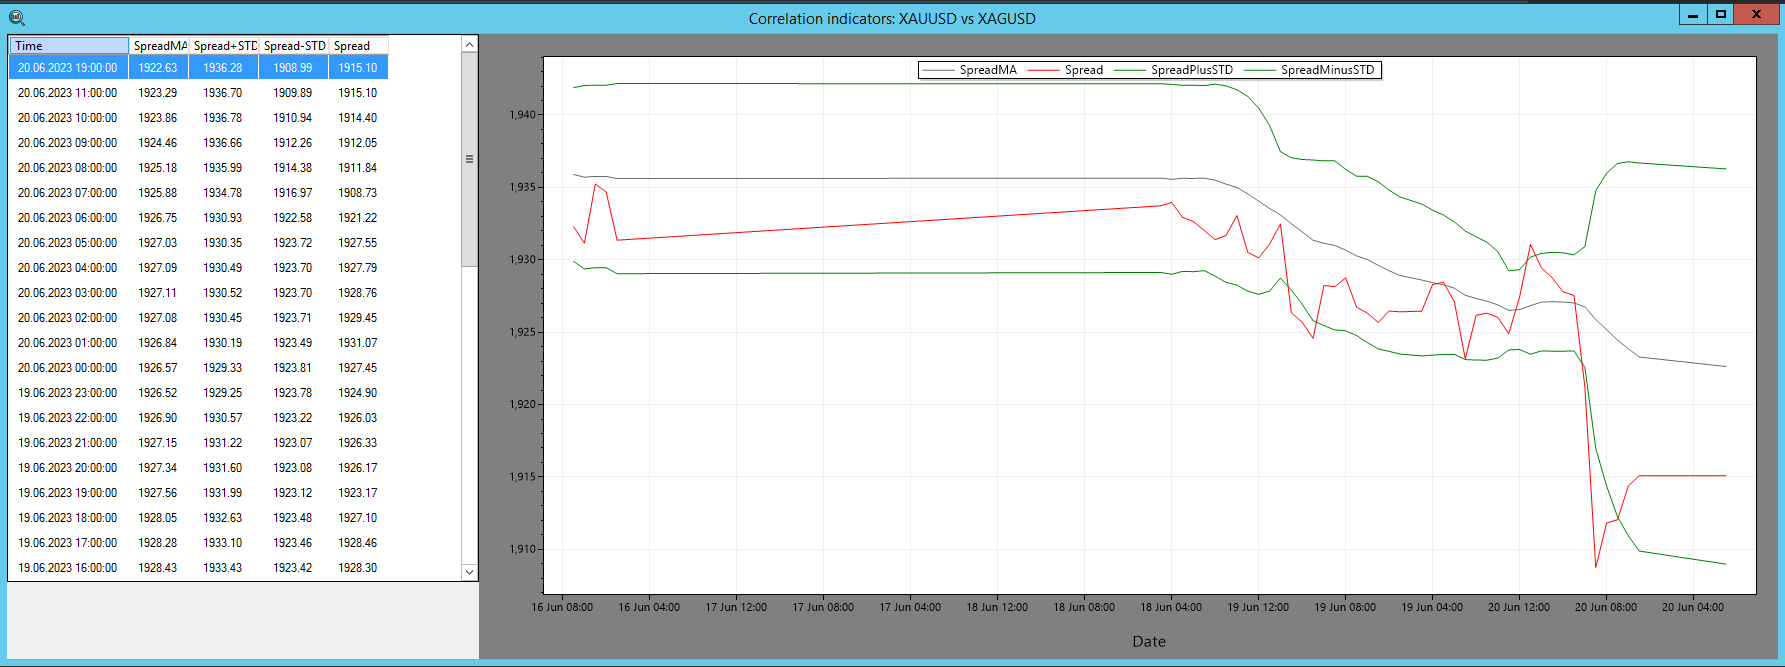
図1 – SharpTrader™ スプレッド・インジケーター
SharpTrader™ アービトラージソフトウェアでは、スプレッドインジケーターを使用して2つの資産間の相関関係を視覚的に表示します。計算には以下の要素が含まれます。
- スプレッド: 2つの資産価格の数値的な差。
- SpreadMA: 指定期間(pi_SpreadMA_Period)におけるスプレッドの移動平均。
- STD(標準偏差): SpreadMA に対するスプレッドの標準偏差。
これらの指標に基づき、統計的アービトラージ理論に従って取引が開始されます。
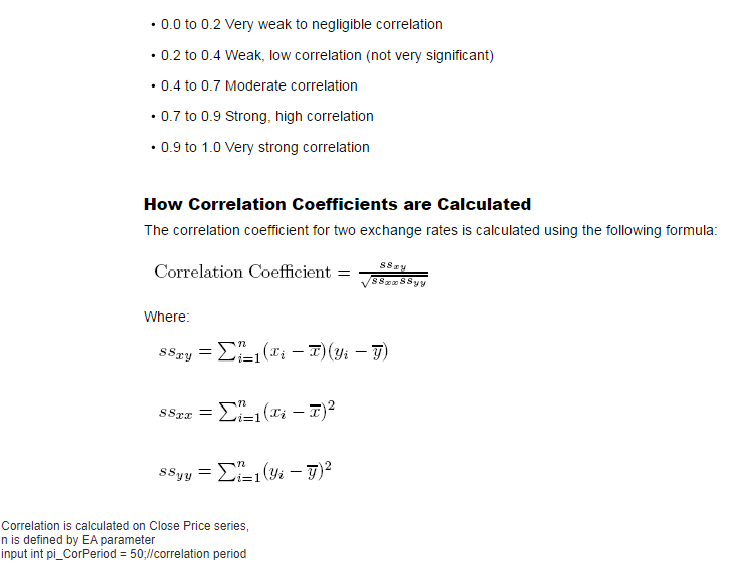
相関計算に関する基礎理論
統計的アービトラージ – 相関行列
相関行列とは、複数の変数間の相関係数を表形式で示したものです。各値は -1 から 1 の範囲で表されます。
相関係数が 1 の場合は完全な正の相関、-1 の場合は完全な負の相関、0 の場合は相関がないことを意味します。
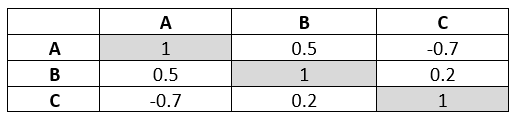
図2 – 相関行列の例
相関行列は、資産間の関係性の把握、ポートフォリオ分散、リスク管理など、金融分野で広く活用されています。
統計的アービトラージ戦略の実装
統計的アービトラージの実装は非常に複雑で、高度な統計ツール、高速計算環境、洗練されたアルゴリズムを必要とします。主なプロセスは以下の通りです。
- ペア選定: 過去に相関または共和分していた資産ペアの特定。
- 閾値設定: 乖離を判断する上限・下限の設定。
- 取引実行: 割安な資産を買い、割高な資産を空売り。
- 決済: スプレッドが平均に回帰した時点でポジションをクローズ。
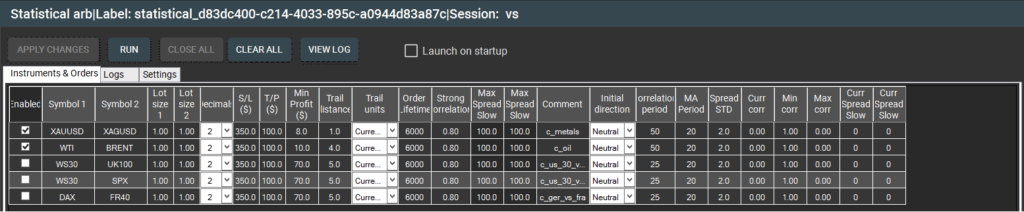
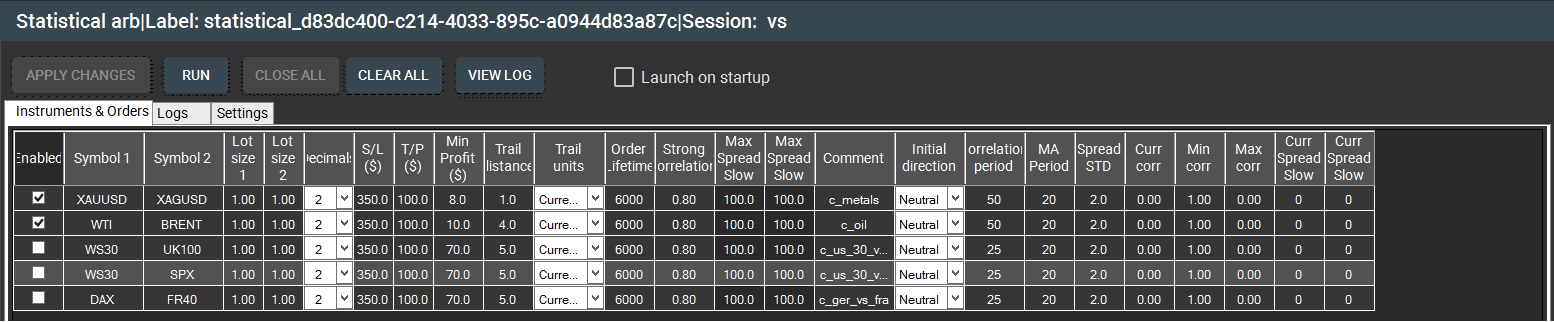
図3 – SharpTrader™ 統計的アービトラージ「インストゥルメント&オーダー」画面

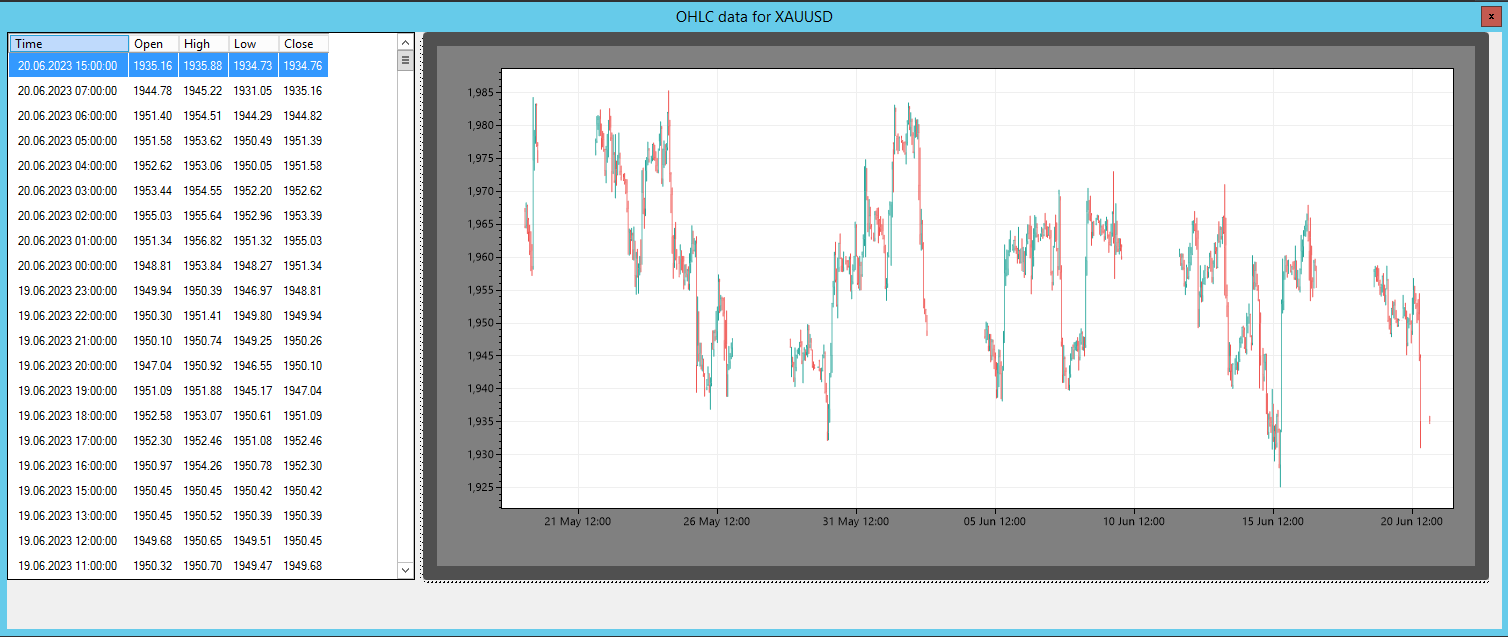
図4 – SharpTrader™ 統計的アービトラージ 価格とグラフ
リスクと制限
統計的アービトラージにおける最大のリスクの一つが「モデルリスク」です。これは、数学モデルが誤った前提条件に基づいている可能性を指します。また、価格の非効率性はミリ秒単位で消失するため、極めて高速な執行が不可欠です。
統計的アービトラージの将来
市場の効率化と自動化が進む中、統計的アービトラージの将来は、より高度なアルゴリズム、機械学習、人工知能(AI)にあります。技術革新の進展とともに、統計的アービトラージも進化し続けるでしょう。
総括すると、統計的アービトラージは高度な数学モデルと高速執行に依存する先進的な取引手法であり、リスクは存在するものの、適切に運用されれば安定的かつ低リスクな利益を狙える魅力的な戦略です。
