Forex Slippage Explained: How to Measure, Detect and Reduce It Montag, der 19. Oktober 2026 – Posted in: Arbitrage Software, Forex trading
Forex Slippage Explained: How to Measure, Detect and Reduce It
Slippage is the difference between the price you asked for and the price you actually got. On one trade it looks like noise. Over hundreds of trades it decides whether a scalping or arbitrage strategy makes money at all. This guide explains where slippage comes from, how to measure it properly from your own trade log, how to tell normal market slippage from one-sided broker execution, and which changes really reduce it.
- What slippage is (with numbers)
- Where slippage comes from: the journey of an order
- The six main causes
- Slippage by order type
- How to measure your slippage step by step
- Reading the distribution: normal or one-sided?
- What slippage costs different strategies
- How to reduce slippage
- Slippage in backtests
- Slippage in latency arbitrage
- Common myths and mistakes
- FAQ
What slippage is (with numbers)
Short answer: slippage is the gap between the expected price of an order (the price on your screen when you sent it, or the price of your stop) and the price at which it was filled. It is negative when the fill is worse for you and positive when the fill is better. It is measured in pips, points or basis points and converted into money through the pip value and position size.
A simple example on EURUSD. You send a market order to buy 1 standard lot (100,000 EUR) when the ask shows 1.08500. The order is filled at 1.08512. The difference is 0.00012, or 1.2 pips against you. With a pip value of about $10 per standard lot, that one trade cost an extra $12 that no chart or backtest showed.
Now the opposite case. The ask is 1.08500, but by the time your order reaches the liquidity provider the price has dropped to 1.08494. A fair execution gives you 1.08494: 0.6 pips of positive slippage, $6 in your favour. Positive slippage is a normal part of honest market execution; it is not a bonus or a mistake.
Stop orders slip too, often more. A sell stop at 1.08200 during a fast move after a data release may be filled at 1.08170: 3.0 pips, or $30 per lot, beyond your planned loss. That is why the stop-loss distance is never the exact maximum loss of a trade.
| Case | Expected price | Fill price | Slippage | Money (1 lot EURUSD) |
|---|---|---|---|---|
| Market buy, price moved up | 1.08500 | 1.08512 | -1.2 pips | -$12 |
| Market buy, price moved down | 1.08500 | 1.08494 | +0.6 pips | +$6 |
| Sell stop during news | 1.08200 | 1.08170 | -3.0 pips | -$30 |
| Buy limit | 1.08400 | 1.08400 or better | 0 or positive | $0 or better, but may not fill |
Where slippage comes from: the journey of an order
Slippage exists because an order is not executed at the moment you decide to trade. It travels. Between the decision price and the fill there are several steps, and the market keeps moving during each of them.
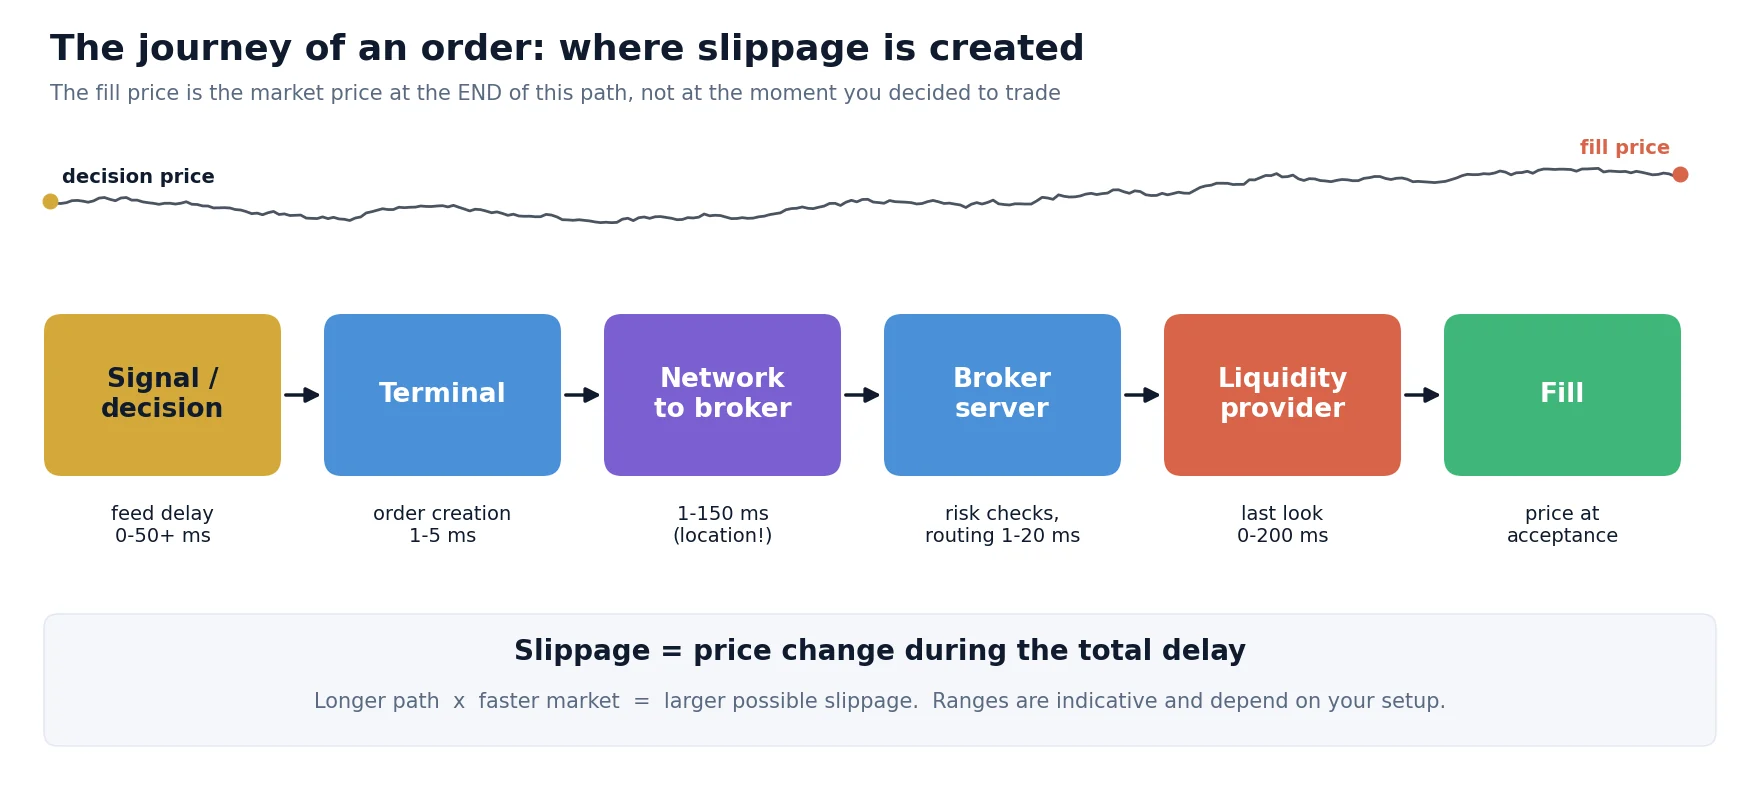
- Signal and decision. Your strategy or your eyes see a price. If that price arrived late (a slow feed), slippage has effectively started before you click.
- Terminal and order creation. Usually a few milliseconds, more on an overloaded computer or with heavy indicators.
- Network to the broker. From under 1 ms on a server in the same data centre to 80–150 ms from a home connection on another continent.
- Broker server. Margin and risk checks, routing rules and sometimes execution plugins that add a delay.
- Liquidity provider. On many ECN/STP setups the provider may hold the order for a short „last look“ window before accepting or rejecting it.
- Fill and confirmation. The price at which the order is accepted becomes your fill. The confirmation travels back over the network.
The longer the total path and the faster the market, the larger the possible price change. This is the same mechanism that creates latency arbitrage opportunities, only seen from the other side.
The six main causes
1. Latency
The time between the decision price and the fill. It includes your feed delay, your network route and processing on the broker side. Latency does not decide the direction of the price change, but it decides how far the price can travel.
2. Volatility
In a quiet Asian session EURUSD may move a fraction of a pip in 100 ms. In the first seconds after a major release it can move several pips in the same time. The same execution delay produces very different slippage.
3. Liquidity and order size
The best quoted price is available only for a limited volume. A large order „walks the book“: part is filled at the best price and the rest at the next levels. On major pairs this matters mostly for large size or during thin hours; on exotic pairs and some metals and indices it matters much earlier.
4. Gaps
Over the weekend, at the daily rollover and around news, the price can jump without trading the levels in between. Stop orders inside such a gap are filled at the first available price, which may be far from the stop level.
5. Order type and execution mode
Market and stop orders accept the next available price; limit orders do not. Accounts also differ in execution mode: with market execution you get the next price, with instant execution the broker may send a requote instead of filling at a different price.
6. Broker execution practices
Most slippage is caused by the market. Some is caused by how the broker handles orders: artificial delays, last look that rejects orders when the price moves in your favour, or rules that pass negative slippage to the client but not positive. We cover how to detect this below and in detail in our guide to broker execution transparency.
Slippage by order type
The order type does not remove price risk; it only decides which risk you take: worse price or no fill.
| Order type | Can it slip? | Main risk | Typical use |
|---|---|---|---|
| Market | Yes, both directions | Worse fill in fast markets | When getting in or out matters more than the exact price |
| Market with maximum deviation | Only within the set range | Rejected if the price moved further | Scalping and algorithmic entries with a strict cost limit |
| Limit | No negative slippage; may improve | Not filled, or partly filled | Planned entries, take profit, passive execution |
| Stop (stop loss, breakout entry) | Yes, often negative | Fill beyond the stop in gaps and news | Protecting a position, momentum entries |
| Stop-limit | Only up to the limit | Position left open if the price jumps past the limit | Breakout entries where a bad fill is worse than no fill |
| IOC / FOK (FIX and ECN) | Only within the limit price | Partial fill (IOC) or no fill (FOK) | Algorithmic and arbitrage execution |
IOC (immediate or cancel) fills whatever is available at the limit price or better and cancels the rest. FOK (fill or kill) fills the full size or nothing. Both are standard on FIX API connections and give an algorithm precise control over the worst acceptable price.
How to measure your slippage step by step
Most traders judge slippage by memory of a few painful trades. That is not a measurement. You need a log and a consistent sign convention.
1
For market orders, the bid (sell) or ask (buy) at the moment of sending; for stops and limits, the order price. Store the timestamp in milliseconds.
2
Fill price, fill time and filled volume for every order, including partial fills and rejections.
3
Slippage = (expected price – fill price) x direction / pip size, where direction is +1 for buys and -1 for sells. Positive means better for you.
4
Multiply by pip value and lots. Sum per day and per month to see the real cost.
5
By symbol, session, news vs normal time, order type and execution time. Averages hide the important patterns.
6
Execution changes when a broker changes liquidity providers or settings. A one-off check goes stale.
Check the sign convention with the first example: buy, expected 1.08500, fill 1.08512. (1.08500 – 1.08512) x (+1) / 0.0001 = -1.2 pips. Negative, so it was against you. For a sell with expected bid 1.08480 and fill 1.08486: (1.08480 – 1.08486) x (-1) / 0.0001 = +0.6 pips, in your favour.
From the log, calculate a small set of numbers. The cards below show what such a summary looks like for an illustrative sample of 500 market orders on a major pair.
Illustrative sample for explanation only, not data from a specific broker or account.
The mean tells you the cost. The tail (5th percentile) tells you the risk for strategies with small targets. The positive/negative ratio and the shape of the distribution tell you whether execution is symmetric, which is the subject of the next section. If you prefer a ready method, our open broker audit toolkit scores execution quality from the same kind of log.
Reading the distribution: normal or one-sided?
When execution is fair, the price is as likely to move for you as against you during the execution delay. The histogram of signed slippage is then roughly symmetric around zero, with a tall bar at zero. When positive slippage is withheld but negative slippage is passed on, the right side of the histogram disappears.
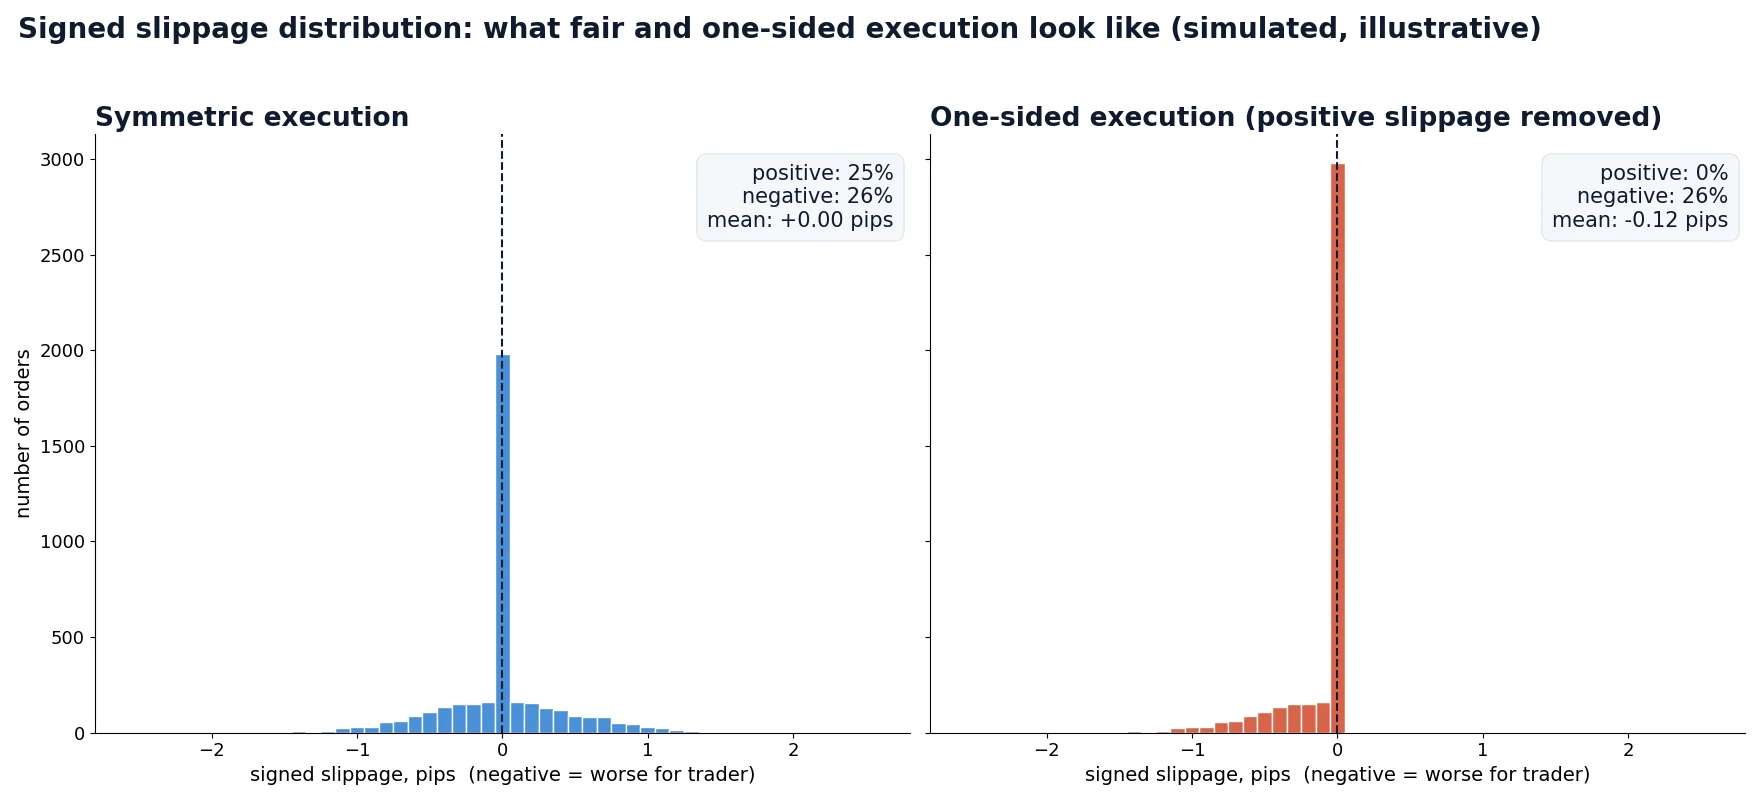
Points to check before drawing conclusions:
- Use at least a few hundred orders; with 30 trades a lopsided result can be chance.
- Separate market orders from stops. Stops are naturally skewed negative because they trigger when the price runs through them.
- Separate news and rollover periods from normal hours.
- Compare execution time with the result. If orders that moved in your favour take much longer to fill, or are rejected more often, that points to last look or deliberate delays.
- Run the same strategy on a second account or broker for comparison when possible.
Asymmetric slippage, requotes that appear only when the price moves in your favour and suspicious execution delays are classic signs of server-side intervention. Our overview of anti-arbitrage plugins explains how such tools work and the Brokers Intervention Detection utility helps to check an account systematically.
What slippage costs different strategies
The same slippage is irrelevant for one strategy and fatal for another. What matters is its size relative to the average gross profit per trade.
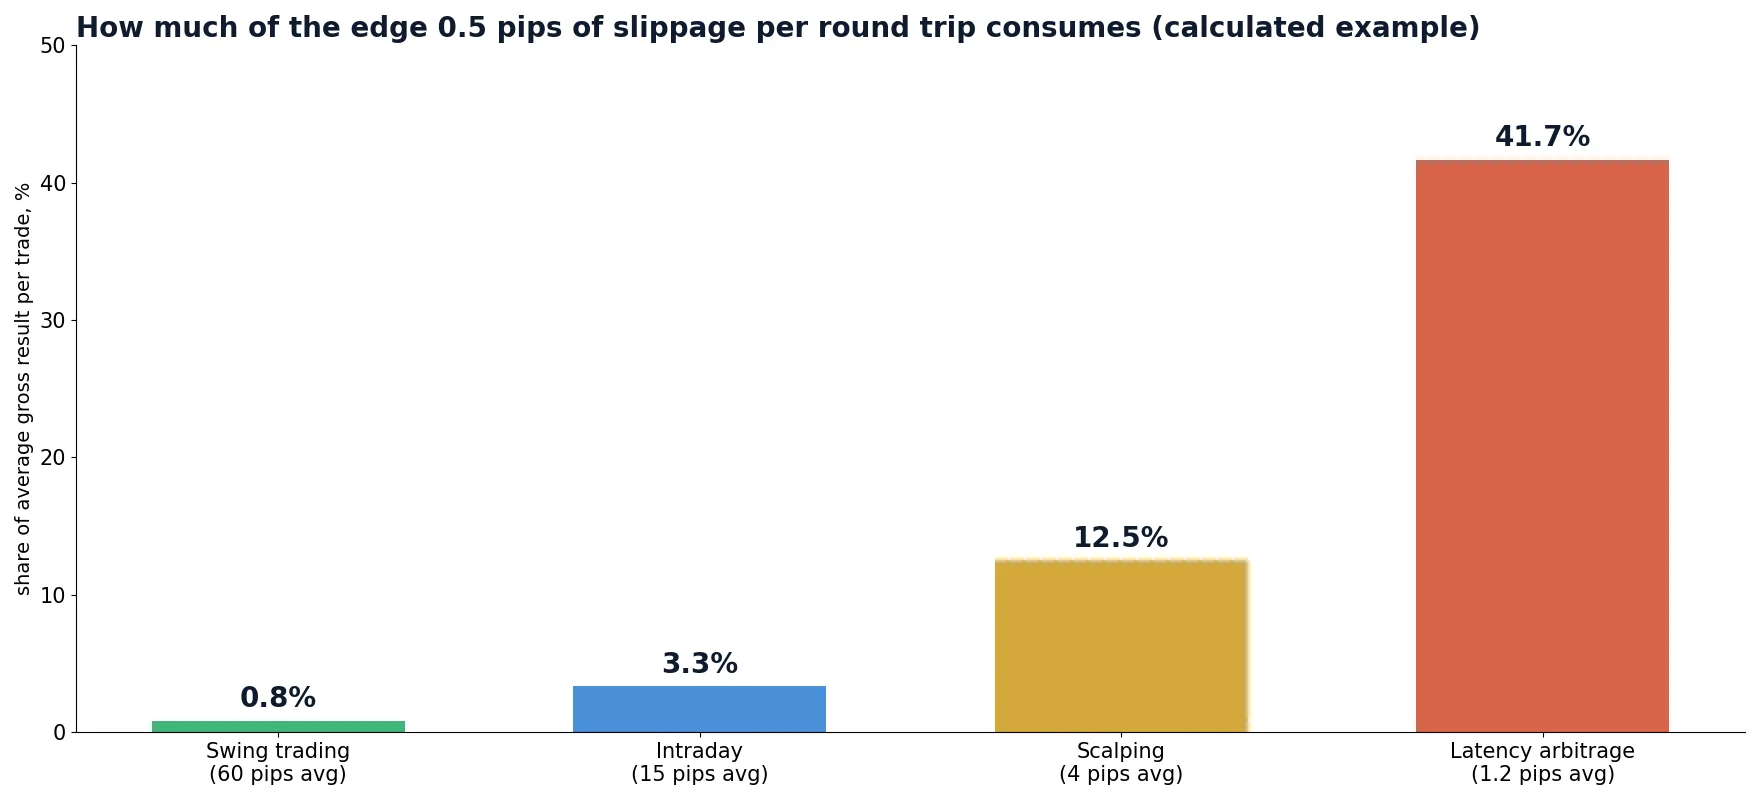
| Strategy profile | Average gross per trade | Slippage per round trip | Share of edge lost |
|---|---|---|---|
| Swing trading | 60 pips | 0.5 pips | 0.8% |
| Intraday trading | 15 pips | 0.5 pips | 3.3% |
| Scalping | 4 pips | 0.5 pips | 12.5% |
| Latency arbitrage | 1.2 pips | 0.5 pips | 41.7% |
In money: a scalper who trades 300 round trips a month with 1 lot and loses 0.5 pips per trade to slippage pays 300 x 0.5 x $10 = $1,500 a month. That is often more than the commission. A strategy that looks profitable with spread and commission included can turn negative once realistic slippage is added, which is why the cost must be measured, not guessed.
How to reduce slippage
You cannot remove slippage, but you can reduce how far the price can move before the fill and limit how much you accept.
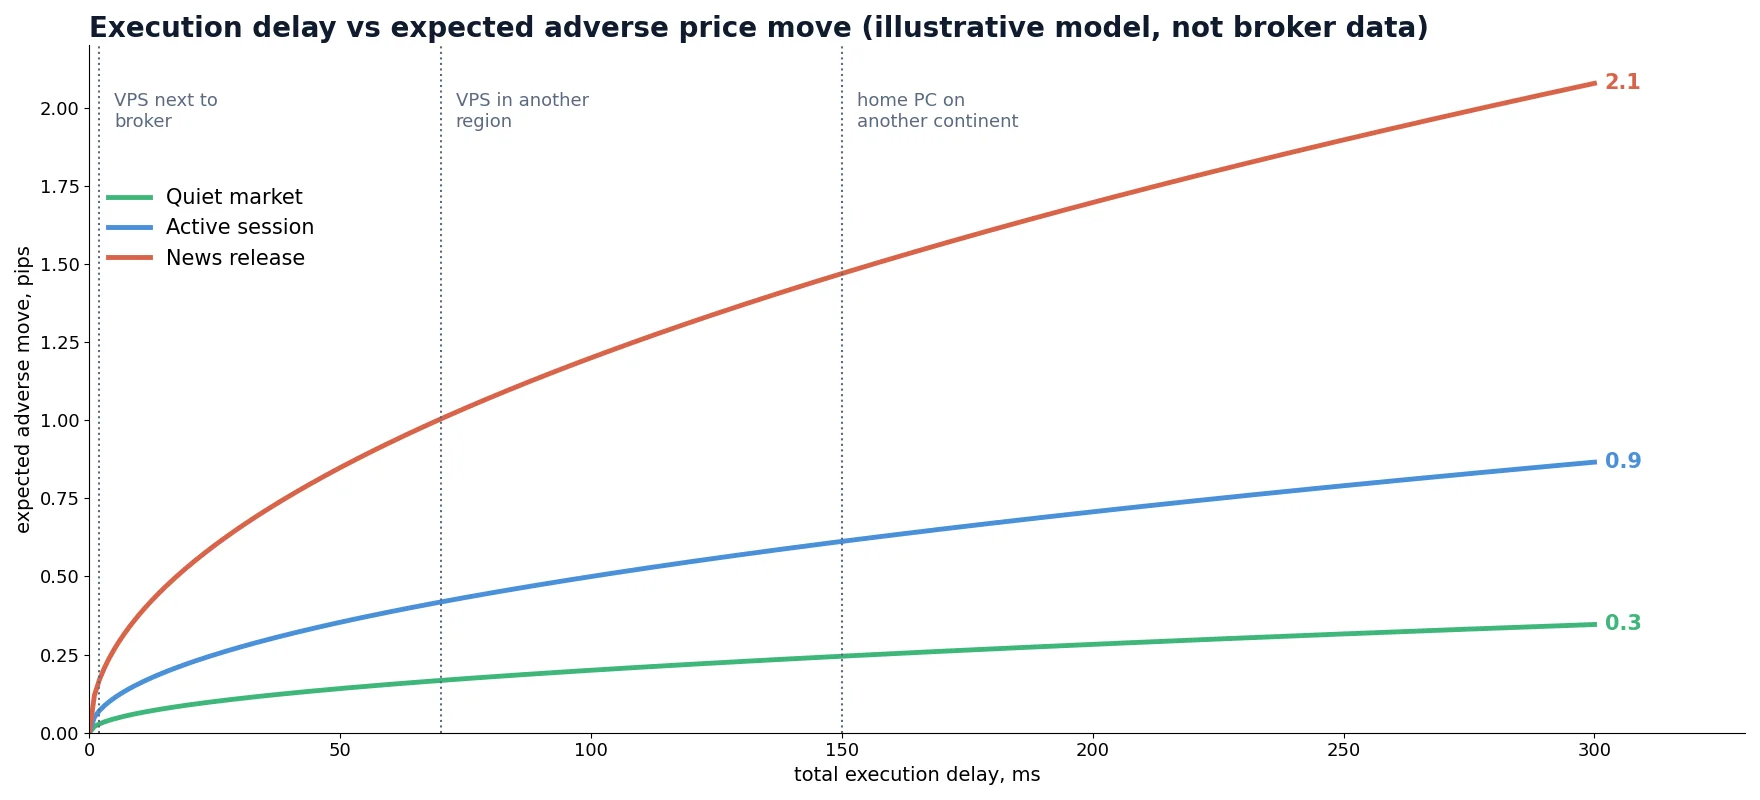
- Move execution closer to the broker. A VPS in the same data centre or city as the broker’s trade server cuts the network leg from tens of milliseconds to one or two. See how fast your VPS needs to be.
- Use a faster price source. A delayed feed means your decision price is already old. A fast reference feed shows the real market earlier.
- Set a maximum deviation or use limit, IOC or FOK orders for entries where a bad fill is worse than no fill.
- Avoid the worst windows unless your strategy is built for them: major releases, the daily rollover hour, the weekly open.
- Trade liquid hours and pairs. The London and New York overlap gives the deepest books on majors.
- Split large orders or reduce size where the book is thin.
- Choose the account type deliberately. ECN/STP accounts with market execution and transparent commission usually show symmetric slippage; check it with your own log.
- Keep the terminal light. Remove unused indicators and scripts and avoid running heavy tasks on the trading machine.
- Monitor continuously and change the venue when the numbers deteriorate.
Slippage in backtests
Most backtests assume that every order is filled at the price of the signal tick. For a swing strategy that is acceptable. For scalping and arbitrage it is the main reason why live results differ from the test.
There are three common ways to model slippage, from simplest to most realistic:
- Fixed slippage: subtract a constant, for example 0.3 pips per side. Easy, but it ignores that slippage is larger exactly when strategies trade most, in fast markets.
- Variable slippage: a distribution from your own trade log, applied per trade, with larger values for news and thin hours.
- Execution-time modelling: the order is filled at the real tick that arrives after a given execution time in milliseconds. Slippage then comes from the tick data itself and grows naturally with volatility.
The third approach is the one we use in SharpTrader Optimizer: it replays real historical ticks, accepts a per-order execution time and resolves the fill price from the tick stream, with variable spread per tick. Our article on the execution time gap in backtests shows how strongly results change between 0 ms and a realistic delay.
Slippage in latency arbitrage
Latency arbitrage is the extreme case. The strategy buys or sells at a slow broker when a faster reference price shows that the broker’s quote is about to move. The expected profit per trade is often only one to a few pips, and the order must be filled before the slow quote catches up.
That has three consequences:
- Every millisecond of execution delay is taken directly from the edge. The price you are trying to catch is moving towards the fill.
- Brokers that do not want this flow often respond with asymmetric slippage or added delays rather than open refusal, so the slippage statistics are also a detection tool.
- Two-leg strategies (for example lock or hedge arbitrage between two accounts) pay slippage twice, once per leg, and the slower leg sets the result.
For arbitrage, execution time and the difference between the signal price and the fill price matter as much as the trade result itself. If you run arbitrage or plan to, log these two numbers for every trade and review them before you change anything else. The SharpTrader arbitrage platform page describes the available strategies and execution settings.
Common myths and mistakes
| Myth or mistake | Reality |
|---|---|
| „Any slippage means the broker cheats.“ | Market slippage is normal. Only systematic one-sidedness, after enough trades and with stops and news separated, is a warning sign. |
| „Zero slippage is the best execution.“ | Zero slippage on every order can also mean requotes or rejections are hiding the real cost. Count rejected orders too. |
| „A limit order solves slippage.“ | It removes negative slippage but adds non-fill risk. Missed good trades are a cost as well. |
| „My stop loss caps my loss exactly.“ | A stop becomes a market order when triggered. In gaps and news it can fill well beyond the level. |
| „Average slippage is all I need.“ | The tail matters more for small targets. Check the 5th percentile and the worst fills by session. |
| „A faster computer fixes it.“ | Usually the network route and feed delay dominate. Location matters more than processor speed. |
Measure execution before you scale a strategy
SharpTrader runs forex and crypto arbitrage strategies with configurable execution settings, and SharpTrader Optimizer lets you test them with realistic execution time on real tick data. Start with the free scanner to see the price differences between your broker and faster sources.
FAQ
Is slippage the broker’s fault?
Usually not. Most slippage comes from the market moving during the execution delay, from volatility and from limited liquidity. It becomes a broker issue when it is consistently one-sided: negative slippage passed on, positive slippage withheld, or delays that appear only when the price moves in your favour.
Can slippage be positive?
Yes. If the price moves in your favour before the fill, fair execution gives you the better price. On a healthy account a noticeable share of market orders gets positive slippage.
How much slippage is normal in forex?
There is no single number. On major pairs during liquid hours with a nearby server, average slippage on market orders is typically a fraction of a pip, with most orders at or near zero. Around news it can be several pips. Measure your own average and 5th percentile and compare them over time and between accounts.
Does a stop loss get slippage?
Yes. A stop loss turns into a market order when the price reaches it, so in fast markets or gaps it can be filled beyond the stop level. A stop-limit avoids that but may leave the position open.
Do limit orders avoid slippage?
Limit orders cannot be filled at a worse price than the limit, so they avoid negative slippage. The trade-off is that they may not be filled at all, or only partly.
Why is slippage worse during news?
During major releases the price moves several pips in milliseconds and liquidity providers widen or pull their quotes. Orders arrive in a market with fewer and worse prices, so both the size and the spread of slippage increase.
Does a VPS reduce slippage?
A VPS close to the broker’s server shortens the network part of the execution delay, which reduces how far the price can move before the fill. It helps most for scalping and arbitrage. It does not help against gaps or one-sided execution practices.
