Broker Execution Scorecard: compare brokers on real execution data
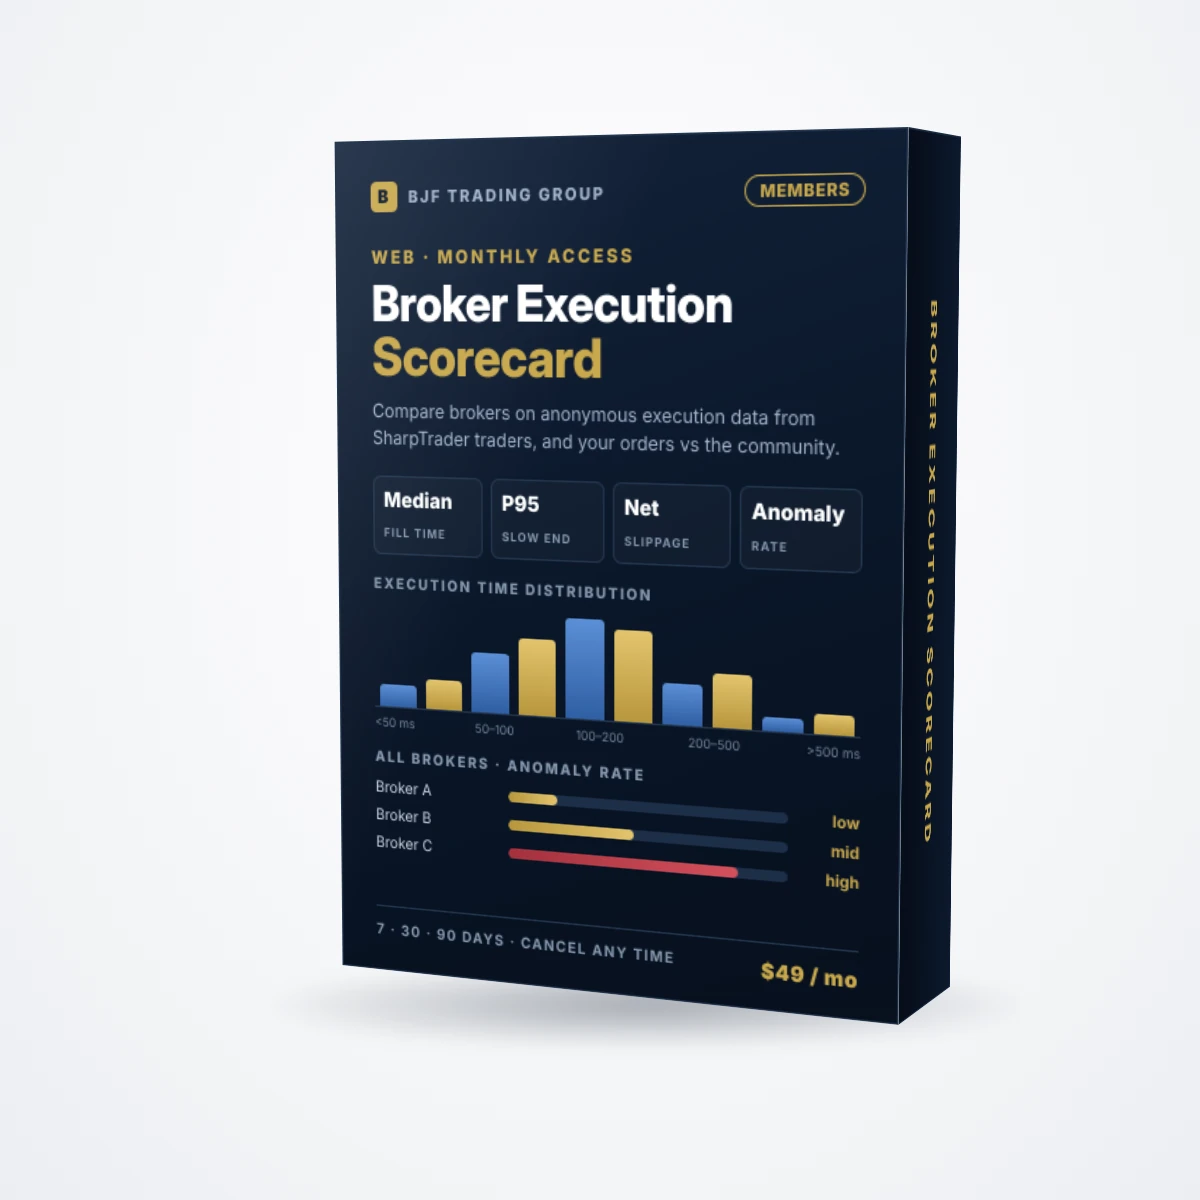
A members’ page on bjftradinggroup.com that aggregates the anonymous execution data of SharpTrader traders who run Broker Intervention Detection. See how fast a broker fills, which way its slippage goes and how often its orders fail critical checks, side by side with every other broker in the database, and put your own orders next to the community.
What you see on the Scorecard
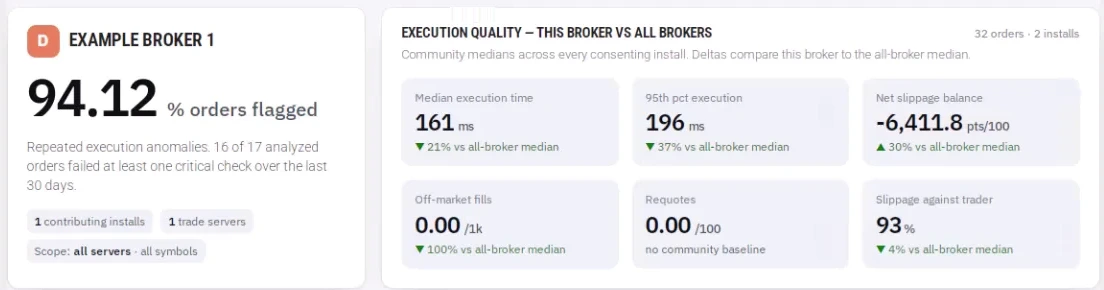
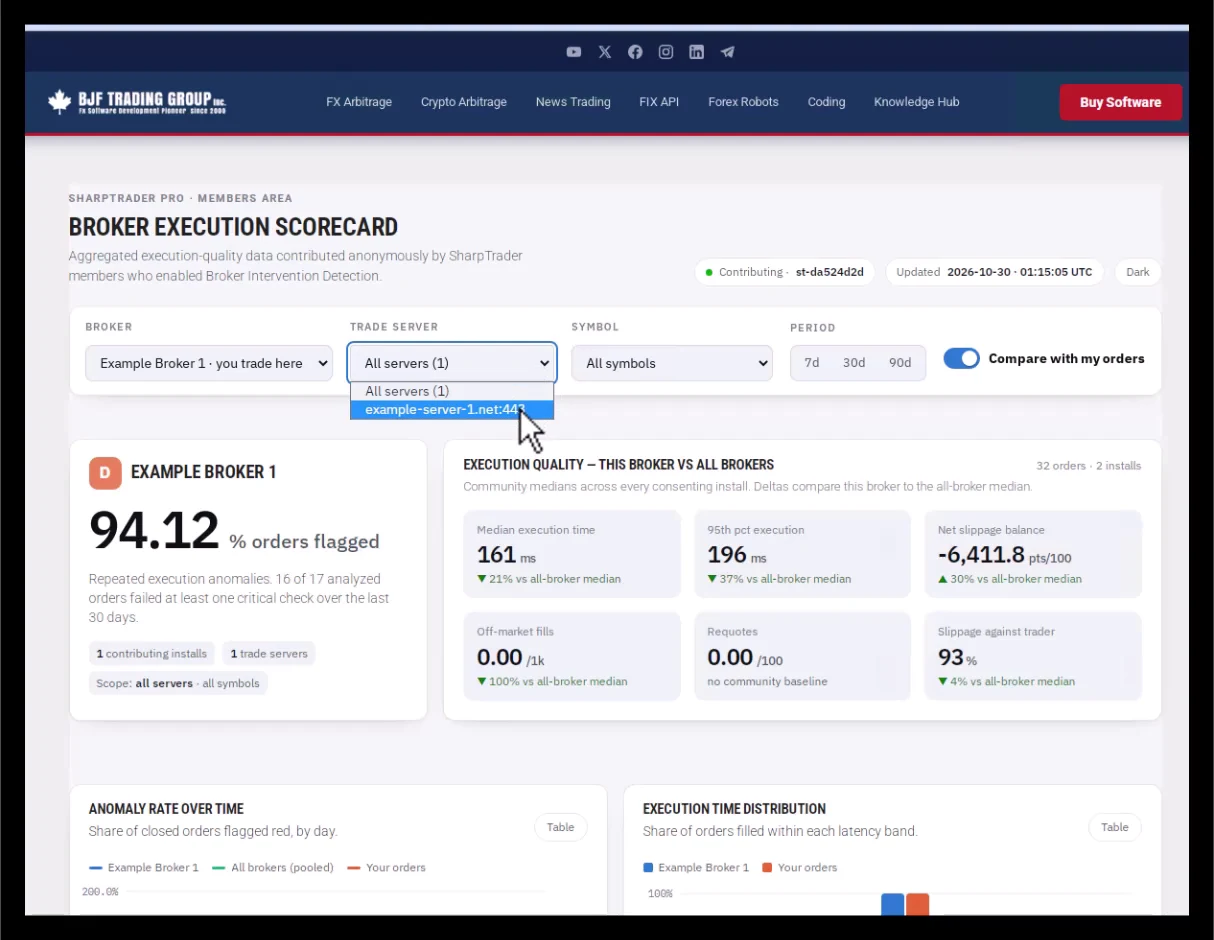
Short answer: pick a broker, a trade server, a symbol and a period, and the Scorecard shows the share of flagged orders, the median and P95 fill times, the net slippage and the off-market and requote rates of that broker, each compared with the median of all brokers.
| Tile | Meaning |
|---|---|
| Orders flagged | Share of the broker’s orders that failed at least one detection check. |
| Median fill | Typical execution time in milliseconds, against the community median. |
| P95 execution | The slow end: catches brokers that are fast on average but spike often. |
| Net slippage | Signed slippage in points. Negative means against the trader; a fair venue sits near a 50/50 split. |
| Off-market fills and requotes | How often fills land outside the quoted market and how often orders are requoted. |
Charts and breakdowns
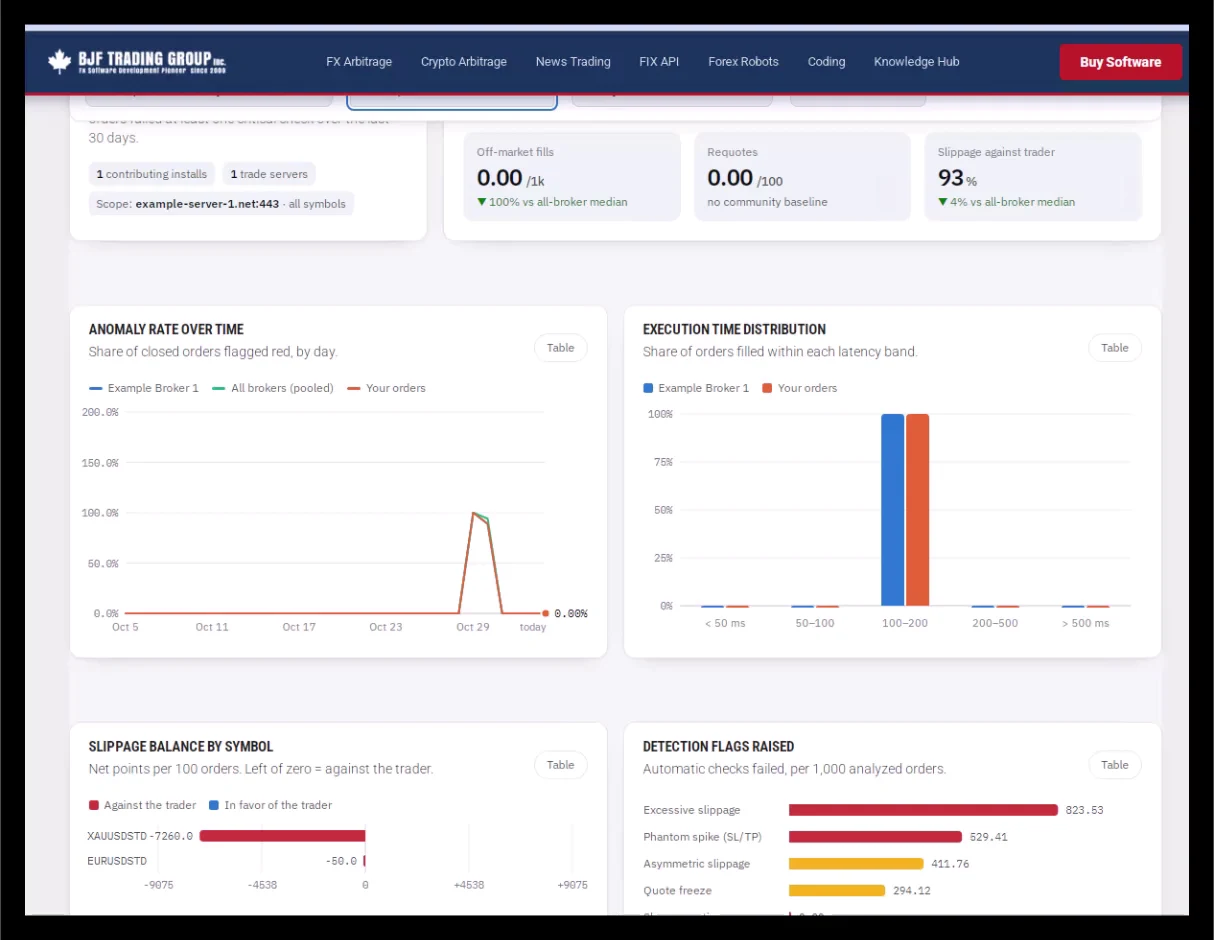
- Anomaly rate over time: the broker’s daily share of flagged orders against the community.
- Execution time distribution: how many fills land in each latency bucket.
- Slippage balance by symbol: which instruments slip against the trader and by how much.
- Detection flags raised: which checks fire most often for this broker.
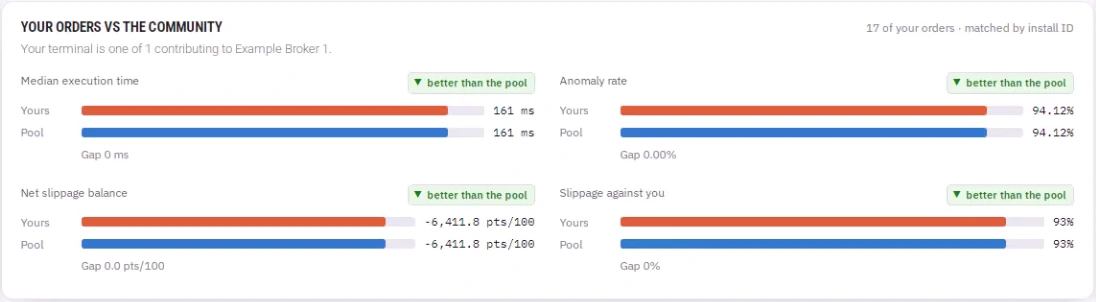
- Your orders vs the community: with Compare with my orders on, your own median fill, slippage and flag rate next to everyone else’s.
All brokers board and member reports
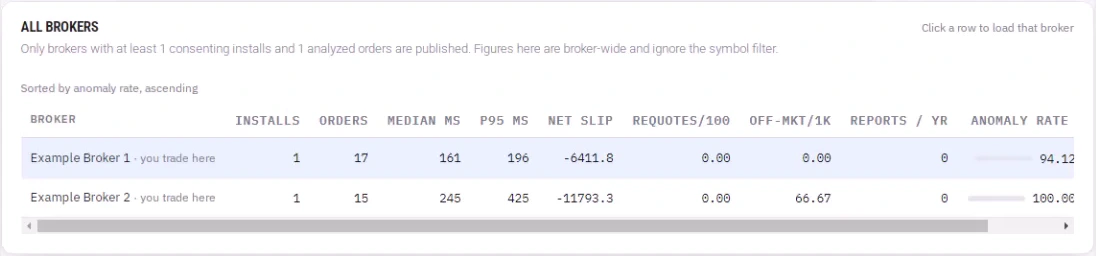
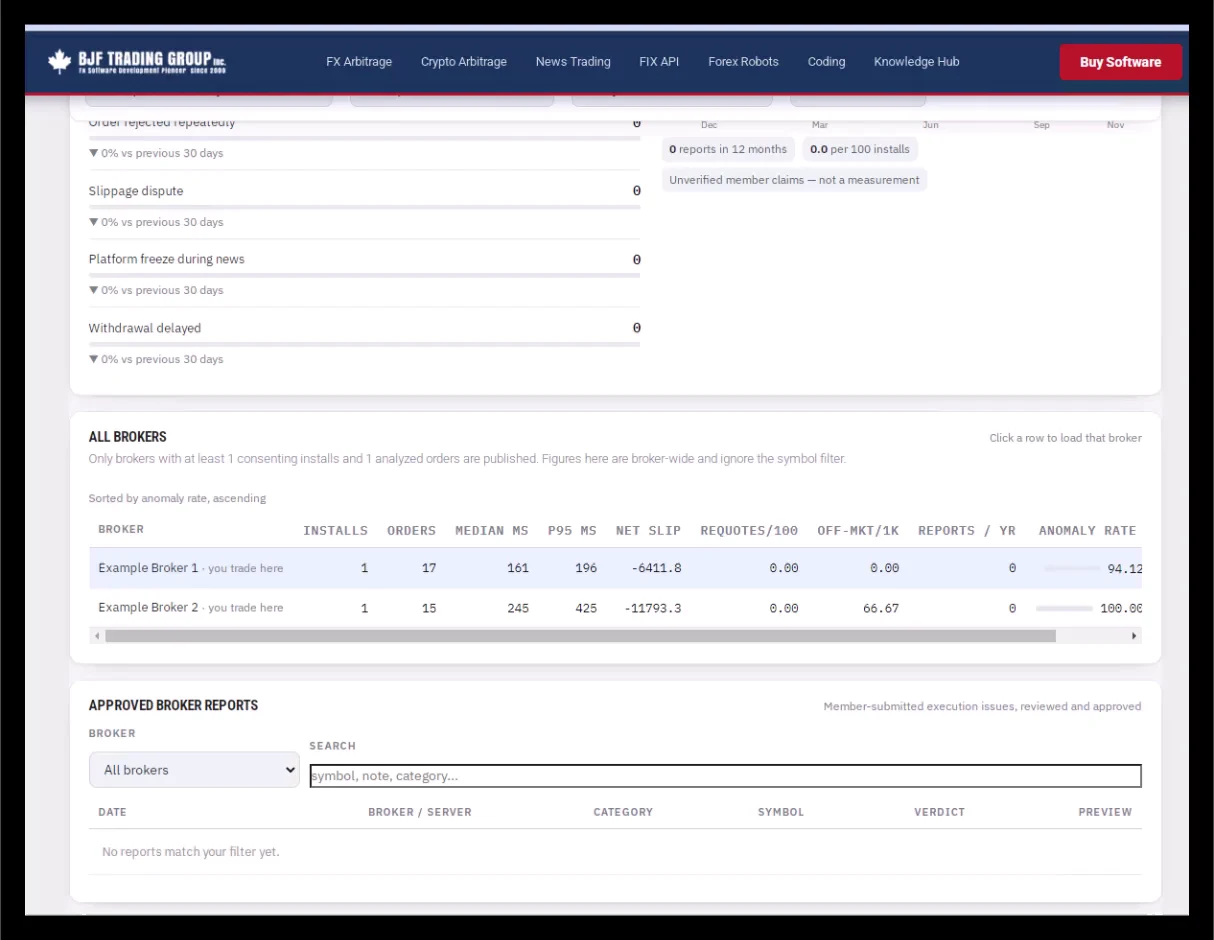
The All brokers table ranks every broker that has enough installs and orders to be published: installs, orders, median and P95 execution time, net slippage, requotes, off-market fills, member reports and anomaly rate. Brokers with too little data are not shown, so no single trader can be identified from the figures.
Approved broker reports are cases that members filed from the terminal with the full Execution Report attached and that passed moderation. You can filter them by broker and search by symbol or category, then open the complete report: times, prices, slippage, spread, failed checks and the quotes around the fill.
How access works
Where the data comes from
Every figure comes from SharpTrader terminals whose owners turned on Broker Intervention Detection and agreed to share anonymous execution data. Account numbers, logins, names, passwords and balances are never collected. Brokers are published only above a minimum number of installs and orders. The Scorecard shows how brokers execute; it does not accuse any of them of breaking rules. An anomaly is a diagnostic signal, not proof.
Check your broker against the community
Median fill, slow-end latency, net slippage and anomaly rate, side by side with every other broker.
FAQ
Do I need the Broker Intervention Detection module?
Yes. The Scorecard is opened from the terminal, and your own orders appear on it only through the module.
Can I cancel?
Yes. The subscription is monthly and can be cancelled from your account at any time.
Which brokers are on the Scorecard?
Every broker with enough opted-in installs and orders in the chosen period. The list grows as more traders share their data.
Can a broker see my data?
No. Data is anonymous and aggregated; brokers are compared, traders are not identified.
Trading involves risk. Scorecard figures are diagnostic statistics, not proof of a broker breach. Not financial advice.