Optimización de Phantom Drift y estrategias Lock en SharpTrader Optimizer 13/07/2026 – Publicado en: Arbitrage Software
Optimización de Phantom Drift y de toda estrategia Lock: por qué Martingale-Plus-Arbitrage necesita backtesting honesto incluso más que latencia
Nuestra prueba de latencia en vivo ya demostró que la optimización de parámetros mueve dinero real: misma estrategia, dos cuentas, y el conjunto ajustado redujo la pérdida media por tres. Las estrategias de la familia Lock tienen dos motores de beneficio apilados uno encima del otro: una escalera de averaging y una pata de lock-arbitrage, así que el beneficio de una optimización honesta es mayor, no menor. SharpTrader Optimizer ahora ajusta ambas mitades juntas, para Hedge, Phantom Drift y todas las variantes Lock.
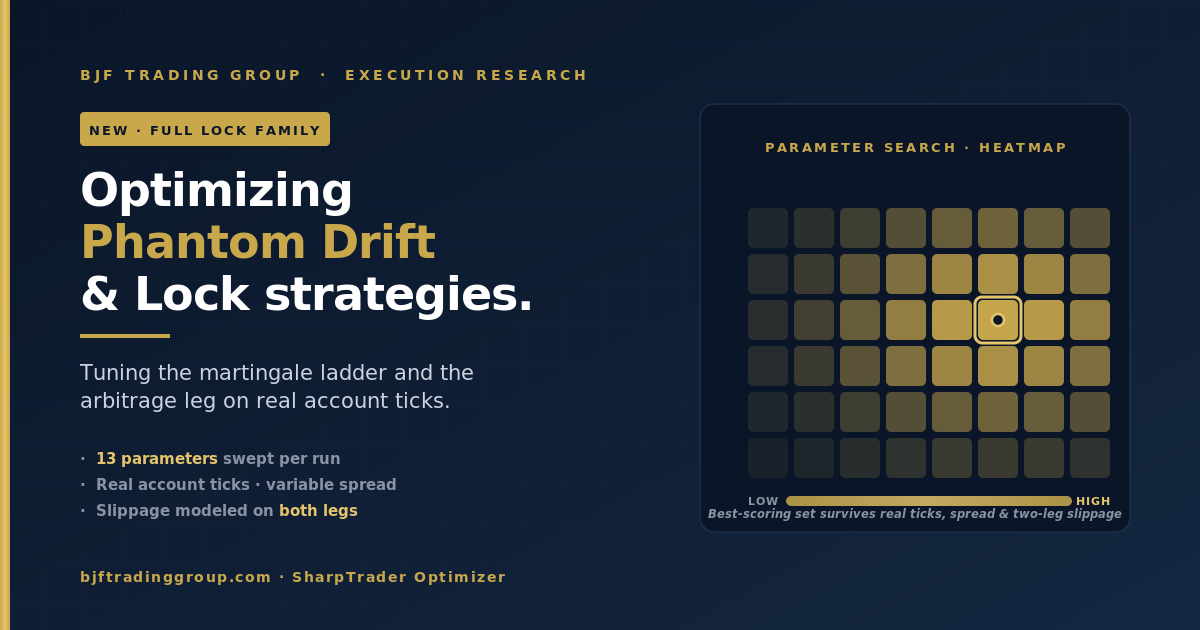
Respuesta breve: SharpTrader Optimizer ahora ejecuta su búsqueda de parámetros con ejecución realista en todas las estrategias de la familia Lock, incluido Phantom Drift. Recorre 13 parámetros numéricos que gobiernan ambas mitades de la estrategia: la escalera de averaging (MaxTrades, LotExponent, PipStep, StopLoss, TakeProfit) y la lógica de arbitrage y salida (DiffToOpen1/2, MaxSpreadFast/Slow, ArbProfit y los controles de beneficio), con cada candidato evaluado sobre datos tick reales, latencia de ejecución modelada, spread variable por tick y slippage en ambas patas. El indicador RSI en sí no forma parte de la grid; en su lugar, ejecutas backtests separados con diferentes ajustes de RSI y comparas cómo cambian el resultado. Como una estrategia multicomponente paga coste de ejecución en cada capa de averaging y en ambos lados del hedge, es mucho más sensible a la honestidad del backtest que el latency arbitrage de una sola pata, y gana más cuando la optimización se hace correctamente.
Lo que acaba de lanzarse
A principios de este año, SharpTrader Optimizer añadió la optimización de la estrategia Hedge y señalamos a la familia Lock completa como el siguiente hito. Ese hito ya está entregado. El optimizer puede ejecutar sus barridos de parámetros con ticks reales y conciencia de ejecución en todas las estrategias de la familia Lock, y eso incluye Phantom Drift, la estrategia que envuelve lock arbitrage dentro de una secuencia de averaging activada por RSI para que los sistemas de riesgo del broker la lean como un trader técnico ordinario.
Lo importante es qué se optimiza. Phantom Drift no es un solo mecanismo, sino dos trabajando en secuencia: una escalera de averaging visible, la parte martingale, que construye profundidad de drawdown, y una pata de lock-arbitrage, la parte arbitrage, que desbloquea la posición con una señal de fast-feed. Hasta ahora podías ajustar esos componentes a mano y esperar. Ahora el optimizer busca el espacio conjunto de parámetros de ambos y puntúa cada candidato como el mercado en vivo realmente lo cobra.
La prueba de latencia ya demostró el principio
Antes de extender el optimizer a estrategias multicomponente, queríamos comprobar que la puntuación con ejecución realista del optimizer se traduce en resultados en vivo en una estrategia que pudiéramos medir con claridad. Así que hicimos el experimento más simple posible: la misma lógica de latency arbitrage en dos cuentas reales a la vez, una con parámetros optimizados y otra con los valores por defecto, mismo instrumento, mismo tamaño de lote, mismo balance inicial. La única variable fue el conjunto de parámetros.
La cuenta optimizada no persiguió una ganancia mayor. Redujo el coste de las operaciones perdedoras, bajando la operación perdedora media de −6.2 pips a −2.0 pips y más que duplicando el profit factor, con menor drawdown. Esa es una estrategia de una sola pata, una entrada y una salida. Ahora pon ese resultado junto a una estrategia que abre una escalera de averaging de posiciones y luego cubre todo el stack con hedge, y pregunta dónde es mayor el apalancamiento de la optimización.
Por qué las estrategias Lock son un problema de optimización más difícil y de mayor impacto
Una operación de latencia de una sola pata paga coste de ejecución dos veces: una al entrar y otra al salir. Un ciclo de Phantom Drift lo paga muchas más veces. Cada capa de averaging es una orden real que cruza un spread real y sufre slippage real. Luego el lock añade una posición hedge, y el unlock la cierra; cada una de esas es una pata con su propio coste de fill. La misma fricción de ejecución que le costó a la cuenta de latencia unos pocos pips por operación perdedora ahora se multiplica a lo largo de toda una escalera y un hedge de dos lados.
El problema de la acumulación en una línea
En latency arbitrage de una sola pata, el coste de ejecución es un impuesto sobre un round trip. En una estrategia martingale-lock, el coste de ejecución se acumula en cada capa de averaging y en ambas patas del hedge, por lo que el mismo error por fill que recortó silenciosamente una cuenta de latencia reconfigura todo el perfil de riesgo de la escalera.
Esa acumulación funciona en ambos sentidos. Significa que una estrategia Lock probada con supuestos perezosos, como datos de barras, fills con latencia cero y spread fijo, se verá mucho más segura y suave de lo que realmente opera, porque no se carga ninguna fricción capa por capa. Y significa que encontrar el conjunto de parámetros que sobrevive al coste de ejecución honesto vale más aquí que en cualquier otro lugar, porque hay más coste que equivocarse.
Las dos mitades que el optimizer ahora ajusta juntas
Los 13 parámetros optimizables se dividen en dos grupos acoplados. El optimizer los busca conjuntamente, porque cómo se espacía y dimensiona la escalera de averaging decide cuánto coste de ejecución absorbe cada pata, mientras que los umbrales de spread y diferencia deciden con qué frecuencia se activa la escalera.
PARTE A · ESCALERA DE AVERAGING
La estructura martingaleLa secuencia visible de construcción de posiciones que ve un broker, y la parte que crea la profundidad de drawdown que necesita el lock. Parámetros barridos:
|
PARTE B · ARBITRAGE & SALIDA
El mecanismo de beneficio y las puertasLos umbrales de diferencia y spread que deciden cuándo merece la pena abrir una posición, más los controles de beneficio que la cierran. Parámetros barridos:
|
Ajustar cualquiera de las dos mitades de forma aislada deja valor sobre la mesa. Una escalera de averaging más profunda o más amplia cambia el drawdown del que la pata de arbitrage debe recuperarse; una puerta de spread o diferencia más estricta cambia con qué frecuencia se construye la escalera en primer lugar. La búsqueda conjunta es el punto clave.
La grid completa de optimización
Estos son los parámetros que varía el sweep, con los rangos min, step y max por defecto. Amplía o reduce cualquier rango para que coincida con tu instrumento y tamaño de cuenta antes de ejecutar la búsqueda.
| Parámetro | Min | Step | Max |
|---|---|---|---|
| StopLoss | 50 | 10 | 100 |
| TakeProfit | 200 | 50 | 500 |
| MinProfit | 10 | 10 | 100 |
| PipsForMinProfit | 10 | 10 | 100 |
| DiffToOpen1 | 10 | 10 | 100 |
| DiffToOpen2 | 10 | 10 | 100 |
| MaxSpreadSlow | 1 | 5 | 50 |
| MaxSpreadFast | 1 | 5 | 50 |
| MaxTrades | 2 | 1 | 6 |
| LotExponent | 1.5 | 0.5 | 3 |
| PipStep | 20 | 10 | 60 |
| MaxProfit | 10 | 10 | 50 |
| ArbProfit | 10 | 10 | 100 |
El indicador RSI no está en la grid, y es deliberado
El indicador de entrada de Phantom Drift, RSI, no es uno de los parámetros numéricos barridos. La grid ajusta los parámetros de construcción de posición, spread, diferencia y beneficio anteriores. Para estudiar cómo afecta el ajuste de RSI a los resultados, ejecuta la optimización por separado en cada configuración de RSI que quieras probar y luego compara los conjuntos de parámetros con mejor puntuación entre esas ejecuciones.
A menudo, esa es una forma más útil de razonar sobre un indicador: en lugar de mezclarlo en una sola grid, obtienes una lectura limpia de cómo un RSI más estricto o más laxo desplaza toda la superficie optimizada, manteniendo honesto todo lo demás.
Por qué los backtesters estándar te engañan en estrategias martingale-lock
La mayoría de los probadores de estrategias retail fueron creados para sistemas direccionales, y hacen tres supuestos que son meramente optimistas para una estrategia direccional pero activamente peligrosos para una martingale-lock: valoran con datos de barras, asumen fills sin latencia y aplican un único spread fijo. En una escalera de averaging, cada uno de esos errores se cobra una vez por capa y luego otra vez en ambas patas del hedge.
Una curva de equity martingale que parece suave en barras M1 puede ser un animal muy diferente cuando cada entrada de averaging paga el spread variable que realmente existía en ese tick, cuando el lock y el unlock pagan cada uno slippage independiente, y cuando el retraso de fill se modela en vez de asumirse inexistente. La diferencia no aparece como un número ligeramente menor. Aparece como un perfil de riesgo diferente, porque la capa que un backtest perezoso dice que sobrevives es la capa que uno honesto dice que rompe el nivel de control de equity.
| Qué se cobra | Backtester estándar | SharpTrader Optimizer |
|---|---|---|
| Resolución de precio | Aproximación de barras M1 / M5 | Ticks reales registrados desde tu propia cuenta |
| Tiempo de ejecución de órdenes | Supuesto instantáneo (latencia cero) | Latencia configurable en milisegundos |
| Spread | Valor fijo por defecto del broker | Spread histórico variable por tick |
| Slippage en cada entrada de averaging | Ignorado o plano | Modelado por fill |
| Patas de lock + unlock | Tratadas como gratis / instantáneas | Ambas patas cobradas de forma independiente |
| Tamaño de grid viable | Pequeño, single-threaded | 100,000+ combinaciones en todos los núcleos |
| Mejores horas de trading | No se muestran | Heatmap de rendimiento de 24 horas |
Qué cambia la puntuación de ejecución honesta en una estrategia Lock
Las cuatro cosas que hicieron fiable el resultado de latencia importan más, no menos, en una estrategia Lock, porque cada una se cobra repetidamente a lo largo de la escalera y el hedge.
|
01
Datos tick reales de tu propia cuentaLos ticks son registrados por SharpTrader desde tu cuenta real de broker, de modo que cada entrada de averaging cae en el precio que tu cuenta realmente vio, con el comportamiento real del broker incluido, no en el open o close de una barra ni en un feed idealizado. En una escalera, la aproximación por barras dimensiona mal de forma silenciosa el drawdown que hereda la pata de arbitrage. |
02
Modelado del tiempo de ejecuciónEstableces un retraso de fill realista en milisegundos. Para la pata de lock-arbitrage, cuyo edge completo es una ventaja de fast-feed, una suposición de latencia cero es exactamente la suposición que la favorece en papel y la hace fallar en vivo. |
|
03
Spread variable por tickCada capa paga el spread que realmente existía cuando se abrió, no un valor fijo por defecto. El averaging suele añadir durante momentos volátiles y de spread amplio, que es precisamente cuando una prueba de spread fijo subestima más el coste real. |
04
Slippage en ambas patasEl lock y el unlock se modelan de forma independiente. Un hedge que una prueba ingenua cierra gratis se cobra honestamente aquí, de modo que la recuperación por ciclo en la prueba es la recuperación que realmente puedes esperar. |
Cómo ejecutar una optimización de Phantom Drift
1. Registra tu propio historial de ticks. SharpTrader recoge ticks directamente desde tu cuenta real de broker, no desde un feed idealizado que el broker entrega. Eso significa que el historial ya contiene exactamente lo que experimenta tu cuenta, incluidos plugins del lado del broker, requotes o particularidades de ejecución. Estás probando contra tus condiciones reales de trading, no contra un feed limpio de laboratorio. Los parámetros no se transfieren entre brokers, así que registra y prueba en la cuenta en la que realmente vas a desplegar.
2. Define una latencia de ejecución realista en milisegundos que refleje la ventaja de tu fast feed frente al broker de ejecución.
3. Define la grid sobre los 13 parámetros: MaxTrades, LotExponent, PipStep, StopLoss y TakeProfit en el lado de la escalera; DiffToOpen1/2, MaxSpreadFast/Slow, ArbProfit y los controles de beneficio en el lado de arbitrage y salida. Ajusta cada min, step y max a tu instrumento y tamaño de cuenta.
4. Ejecuta el sweep en todos los núcleos. Una gran grid multiparámetro termina en horas, con spread variable por tick y slippage de dos patas cargados en cada candidato.
5. Lee el heatmap y la puntuación. Ordena por profit factor y drawdown, no por la win rate visible, y usa el heatmap de 24 horas para ver qué sesiones realmente sostienen el edge.
6. Repite por ajuste de RSI. Como RSI no se barre en la grid, vuelve a ejecutar el sweep en cada configuración de RSI que quieras comparar y observa cómo cambia el mejor conjunto de parámetros entre ellas.
Qué significa esto en la práctica
- Se optimizan ambas mitades, no solo el arbitrage. La escalera de averaging es donde vive la mayor parte del coste de ejecución oculto, así que ajustarla contra fills honestos es de donde viene buena parte de la mejora.
- Optimiza por profit factor y drawdown, no por la win rate enmascarada. Como mostró la prueba de latencia, la win rate que se ve mejor no es la cuenta que conserva más dinero.
- Recalibra por instrumento y por broker. El perfil de ejecución de una estrategia Lock es específico del broker; un set ajustado en un entorno no es válido en otro.
- Nunca confíes en una prueba de latencia cero y spread fijo sobre una escalera. Es la configuración garantizada para ocultar la capa que realmente rompe la estrategia.
Preguntas frecuentes
Sí. Phantom Drift forma parte de la familia Lock, y el soporte completo para la familia Lock ya está lanzado. El optimizer ejecuta su barrido de parámetros con ticks reales y conciencia de ejecución en Phantom Drift igual que lo hace para estrategias Latency y Hedge.
Ambas, y de forma conjunta. El optimizer barre los parámetros de la escalera de averaging (MaxTrades, LotExponent, PipStep, StopLoss, TakeProfit) junto con los parámetros de arbitrage y salida (DiffToOpen1/2, MaxSpreadFast, MaxSpreadSlow, ArbProfit, MinProfit, PipsForMinProfit, MaxProfit). Los dos grupos están acoplados, así que ajustarlos juntos es el punto. El indicador de entrada RSI no forma parte de la grid.
Porque el coste de ejecución se acumula. Una operación de latencia de una sola pata paga spread y slippage en un round trip. Una estrategia Lock lo paga en cada capa de averaging y en ambas patas del hedge. Un backtester que asume latencia cero y spread fijo subestima ese coste una vez para latencia, pero muchas veces para una escalera, lo suficiente para cambiar todo el perfil de riesgo de la estrategia en lugar de solo su resultado final.
Trece parámetros numéricos: StopLoss, TakeProfit, MinProfit, PipsForMinProfit, DiffToOpen1, DiffToOpen2, MaxSpreadSlow, MaxSpreadFast, MaxTrades, LotExponent, PipStep, MaxProfit y ArbProfit. Cada uno tiene min, step y max configurables. El indicador de entrada RSI no se barre en la grid; para estudiar su efecto, ejecuta la optimización por separado con diferentes ajustes de RSI y compara.
De tu propia cuenta. SharpTrader registra ticks directamente desde tu conexión real de broker, por lo que el historial contra el que optimizas es el flujo exacto de precios que recibió tu cuenta, con el comportamiento real de ejecución del broker incluido, tanto si el broker ejecuta plugins en tu cuenta como si no. No pruebas sobre un feed idealizado o limpiado que publica el broker; pruebas sobre lo que realmente llegó a tu terminal. Esto es lo que hace que los parámetros sean específicos del broker y que los resultados representen condiciones en vivo.
No dentro de la grid de parámetros, que barre los 13 parámetros numéricos de posición, spread, diferencia y beneficio. Para ver cómo afecta RSI a los resultados, ejecuta la optimización por separado en cada configuración de RSI que quieras probar y luego compara los conjuntos de parámetros con mejor puntuación entre esas ejecuciones. Esto da una lectura más limpia de cómo un RSI más estricto o más laxo desplaza toda la superficie optimizada que mezclarlo en una sola grid.
No. Cada instrumento tiene su propio comportamiento de spread y volatilidad, y cada broker tiene su propio perfil de ejecución. Un conjunto de parámetros solo es válido para las condiciones en las que fue ajustado, así que el sweep debe volver a ejecutarse por instrumento y por entorno de broker antes de desplegar.
Sí, está lanzada. Los usuarios actuales de SharpTrader Optimizer pueden solicitar la última build, y cualquiera que esté considerando la herramienta puede ver la lista completa de funciones en la página del producto. Escribe a support@bjftradinggroup.com para obtener la build o ayuda configurando un sweep de estrategia Lock.
Suscríbete a la investigación de trading de BJF
Nuevos estudios de ejecución, guías del optimizer y lanzamientos de producto – entregados cuando los publicamos.
Ajusta tus estrategias Phantom Drift y Lock con honestidad
SharpTrader Optimizer ahora barre toda la familia Lock, Hedge y Phantom Drift, tanto en la escalera de averaging como en la pata de lock-arbitrage, puntuando cada candidato con datos tick reales, tiempo de ejecución modelado, spread variable y slippage de dos patas. Encuentra el conjunto de parámetros que sobrevive en producción, no solo el que se ve suave en barras.
