BJF TRADING GROUP · GUIDE
Broker Execution Quality: How to Measure Slippage, Latency and Broker Intervention
Your strategy decides when to trade. Your broker decides at what price and how fast. This guide explains what execution quality is, which numbers describe it, which patterns point to intervention rather than bad luck, how to measure them on your own orders, and what to do with the results.
Broker execution quality is how fast, how close to the quoted price and how fairly a broker fills your orders. It is not visible in a trade history, but it can be measured: execution time, signed slippage, spread at the fill and deviation from an independent price feed, order by order. This guide shows which numbers matter, where normal execution ends, and how to compare your broker with other traders’ brokers on real data.
Key takeaways
- Slippage is normal; one-sided slippage is not. On fair execution, slipped fills go for you about as often as against you.
- Judge the slow end, not only the average. The P95 execution time shows the delays that hit you in fast markets.
- You need a reference feed. Without an independent price, a phantom spike that stops you out looks like a real market move.
- Trust patterns, not single orders. Dozens to hundreds of fills per symbol, across days and symbols, before drawing conclusions.
- Your orders tell you about your account; many traders’ orders tell you about the broker. Anonymous community data separates a bad setup from a bad broker.
In this guide
- What execution quality means
- The metrics that matter
- Normal execution vs intervention patterns
- Why brokers’ execution differs
- How to measure execution on your own orders
- Thresholds: where normal ends
- Statistics: when a pattern is real
- What to do with the results
- Comparing brokers with community data
- Reading a broker Scorecard, panel by panel
- Tools: Broker Intervention Detection and the Scorecard
- Limits and honest caveats
- FAQ
What execution quality means
Short answer: execution quality is how closely, how quickly and how fairly your broker turns an order request into a fill. It is measured by execution time, slippage against the quoted price, the spread at the fill, and how the broker’s prices compare with the wider market at that moment.
A trading terminal shows you the result: an open price, a close price and a profit. It does not show the path. Between the moment your order leaves and the moment it is filled, the broker may take 50 ms or 500 ms, the price may move for you or against you, and the spread may widen. For swing trading these details are noise. For scalping, news trading and every kind of arbitrage they are the whole game: a strategy that earns 2 points per trade cannot survive a broker that costs 3.
Execution quality is also the gap between a backtest and live trading. A backtest assumes fills at the quoted price after a fixed delay. Live trading gives you whatever the broker’s execution gives you. Measuring execution is how you find out which of the two you are really trading. If you test on ticks, our guide to forex tick data for backtesting explains how to make the backtest side as honest as possible.
The metrics that matter
| Metric | Definition | Why it matters |
|---|---|---|
| Execution time | Milliseconds from the order request to the fill, measured separately for the open and the close. | The longer the delay, the more the price can move before the fill. Fast strategies lose their edge first. |
| Signed slippage | Fill price minus requested price, in points, signed so that negative means against you. | Slippage itself is normal. Slippage that is mostly negative is not. |
| P95 execution time | The time below which 95% of fills land. | Catches brokers that are fast on average but spike often, usually at the worst moments. |
| Spread at the fill | Ask minus bid when the order was filled, against the symbol’s average. | A spread that widens exactly when you trade is a cost a fixed-spread backtest never sees. |
| Reference deviation | Distance between the broker’s price and an independent reference feed at the same moment. | Shows whether the broker’s price agreed with the market or only with itself. |
| Off-market fills | Fills outside every bid and ask quoted between request and fill. | A fill at a price that was never quoted is the clearest red flag there is. |
| Requotes and rejections | Orders answered with a new price, or rejected and resent. | Frequent requotes on profitable entries cost you the best trades. |
| Quote freezes | Gaps in the broker’s quote stream while the market kept moving. | Orders filled during a freeze are filled against a stale price. |
For a deeper look at slippage alone, including how to calculate it and how to reduce it, see Forex Slippage Explained.
Normal execution vs intervention patterns
No broker fills every order at the exact requested price in zero milliseconds. The question is never “is there slippage” but “does the execution behave like a fair market”. These are the patterns that separate the two.
| Pattern | Normal execution | Possible intervention |
|---|---|---|
| Slippage direction | Roughly balanced: about as many fills slip for you as against you. | One-sided: most slipped fills go against you, especially on profitable entries. |
| Execution time | Stable, with occasional spikes during news. | Slow only on some accounts, or slow on one side of the trade: fast to close losers, slow to close winners. |
| Stops | Hit by prices other venues also printed. | Hit by a short spike that no reference feed shows (phantom spike). |
| Quotes | Continuous, with brief gaps on illiquid symbols. | Quote stream stalls while the market is moving, and orders are filled during the stall. |
| Requotes | Rare and in both directions. | Frequent on entries that would be profitable, rare on the others. |
Each of these patterns can also have an innocent cause. A one-sided pattern over hundreds of orders, across several symbols, which disappears on another broker with the same strategy, is much harder to explain innocently.
Why brokers’ execution differs
Brokers do not all make money the same way, and the business model shapes the execution.
- Agency or A-book brokers pass orders to liquidity providers and earn a commission or markup. Their execution reflects the provider’s fills plus network delay.
- Market-maker or B-book brokers take the other side of client trades. Their dealing software can apply delays, asymmetric slippage or wider spreads to accounts it considers too profitable.
- Hybrid brokers route clients to either book, sometimes switching an account once it starts winning, which is why execution can change after a good month.
Dealing desks have tools built for this purpose, from latency plugins to virtual-dealer settings. Our guide to broker execution transparency walks through A-book, B-book, hybrid routing and last look in detail, and our article on anti-arbitrage plugins brokers use describes how they work. The point here is practical: you cannot tell from a broker’s website which kind of execution you will get. You can only measure it.
How to measure execution on your own orders
Measuring execution properly needs four ingredients. Each one closes a gap that a simple trade history leaves open.
1
2
3
4
From these, compute per order the execution time of each side, the signed slippage, the spread at the fill and the reference deviation, then flag orders that cross your thresholds. Doing this by hand from exported trades is possible for a few orders and impractical for a live strategy, which is why we built it into SharpTrader.
Thresholds: where normal ends
There is no universal threshold: a gold scalper on a VPS next to the broker and a swing trader on a home connection live in different worlds. These are the defaults we use in Broker Intervention Detection, a reasonable starting point for short-term strategies on a nearby VPS.
| Check | Default threshold | Notes |
|---|---|---|
| Slow execution | > 200 ms on the open or the close | Raise it if your VPS is far from the broker’s server. |
| Excessive slippage | > 10 points against you | Scale it to the symbol: 10 points is a lot on EURUSD and little on an index. |
| Spread spike | ≥ 3× the symbol’s average and ≥ 1 point wider | Expect spikes around news and rollover. |
| Phantom spike | Adverse move ≥ 2 points not seen on the reference feed | Needs a reference feed. |
| Quote freeze | No quote for > 2,000 ms while the reference ticks | Illiquid symbols freeze naturally; compare with the reference. |
| Asymmetric latency | Slower side ≥ 3× the faster side and ≥ 50 ms longer | Watch for slow closes on winning trades. |
| Rejected & resent | Same symbol and side rejected within 10 s before | Check volume and stop levels first. |
Statistics: when a pattern is real
One bad fill proves nothing. Twenty bad fills in a row on one symbol deserve attention. The simplest useful test is about slippage direction: on fair execution, a slipped fill is roughly as likely to go for you as against you, like a coin toss. If 18 of your last 20 slipped fills went against you, the chance of that happening on a fair coin is about 0.02%.
Broker Intervention Detection applies this idea as the asymmetric slippage check: over the strategy’s last 50 fills, it flags the pattern when at least 65% of the slipped fills went against you and a binomial test puts the result below p = 0.05. Use the same discipline for every pattern: count, compare with what chance would produce, and compare with a second broker or the community before you conclude anything.
What to do with the results
- Check your own side first. VPS location, ping, clock offset and order size can explain slow fills and rejections.
- Adjust the strategy. If execution time is high but fair, add a slippage buffer, avoid the worst hours or widen targets; adaptive exits help here, see adaptive exits and the slippage factor.
- Document and ask. Send the broker the order ticket, the times, the quotes around the fill and the reference price. A per-order report with this data gets a much better answer than “your execution is bad”.
- Compare and move. If the pattern is one-sided and persistent, test the same strategy with another broker and compare the same metrics side by side.
Comparing brokers with community data
Your own orders tell you about your account. Many traders’ orders tell you about the broker. When execution data from many terminals is pooled anonymously, the noise of individual connections averages out and the broker’s real behaviour remains: its typical and slow-end fill times, the direction of its slippage, how often its fills land off the market. A broker that is fast and fair for the community but slow for you points to your setup; a broker that is slow and one-sided for everyone points to the broker.
Pooled data needs safeguards: no account numbers or names, publication only above a minimum number of traders and orders, and moderation of any report that names a specific case.
Reading a broker Scorecard, panel by panel
The Broker Execution Scorecard is where the community data from SharpTrader terminals is published. Here is how to read it, using the demo broker from our screenshots. The brokers on these screenshots are examples, and the numbers come from a test setup, not from a real broker.
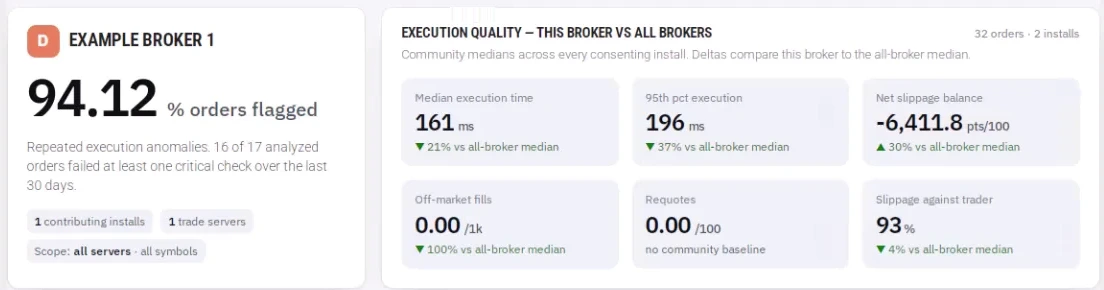
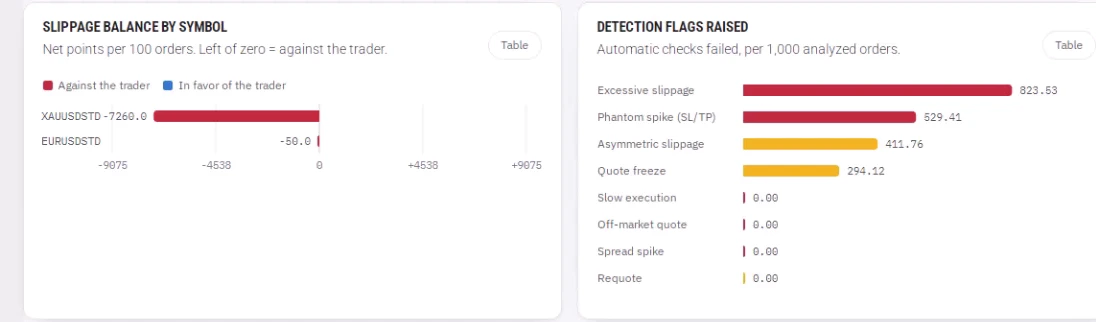
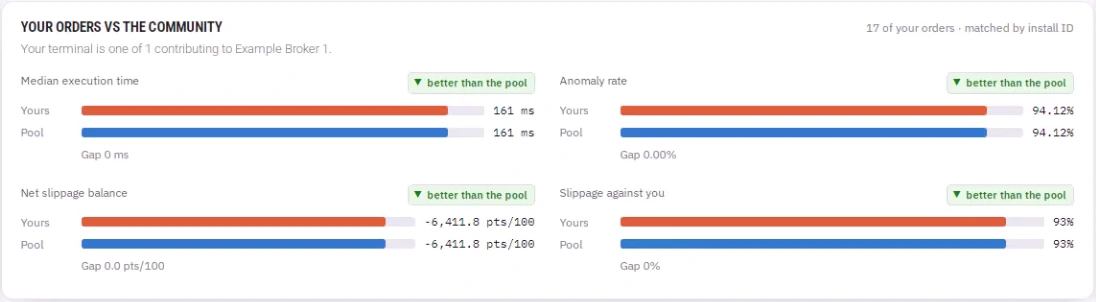
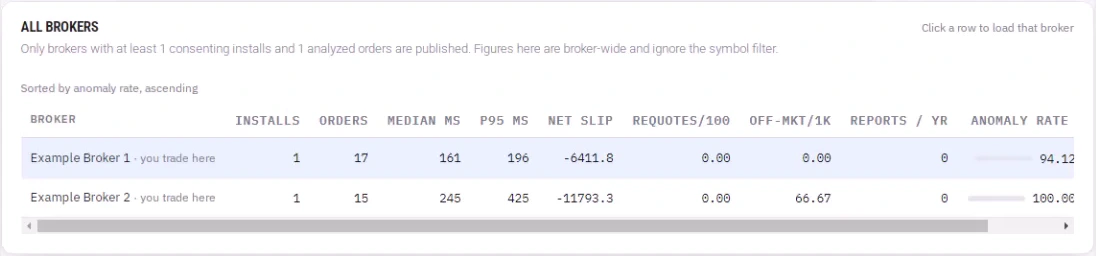
Read the panels in this order and the story is usually clear in a minute:
Brokers appear on the Scorecard only above a minimum number of installs and orders. An anomaly rate is a diagnostic signal, not proof of a breach. Member reports are counted separately from automatic detection: a report is a claim, a flag is a measurement.
Tools: Broker Intervention Detection and the Scorecard
We built both halves of this workflow into SharpTrader.
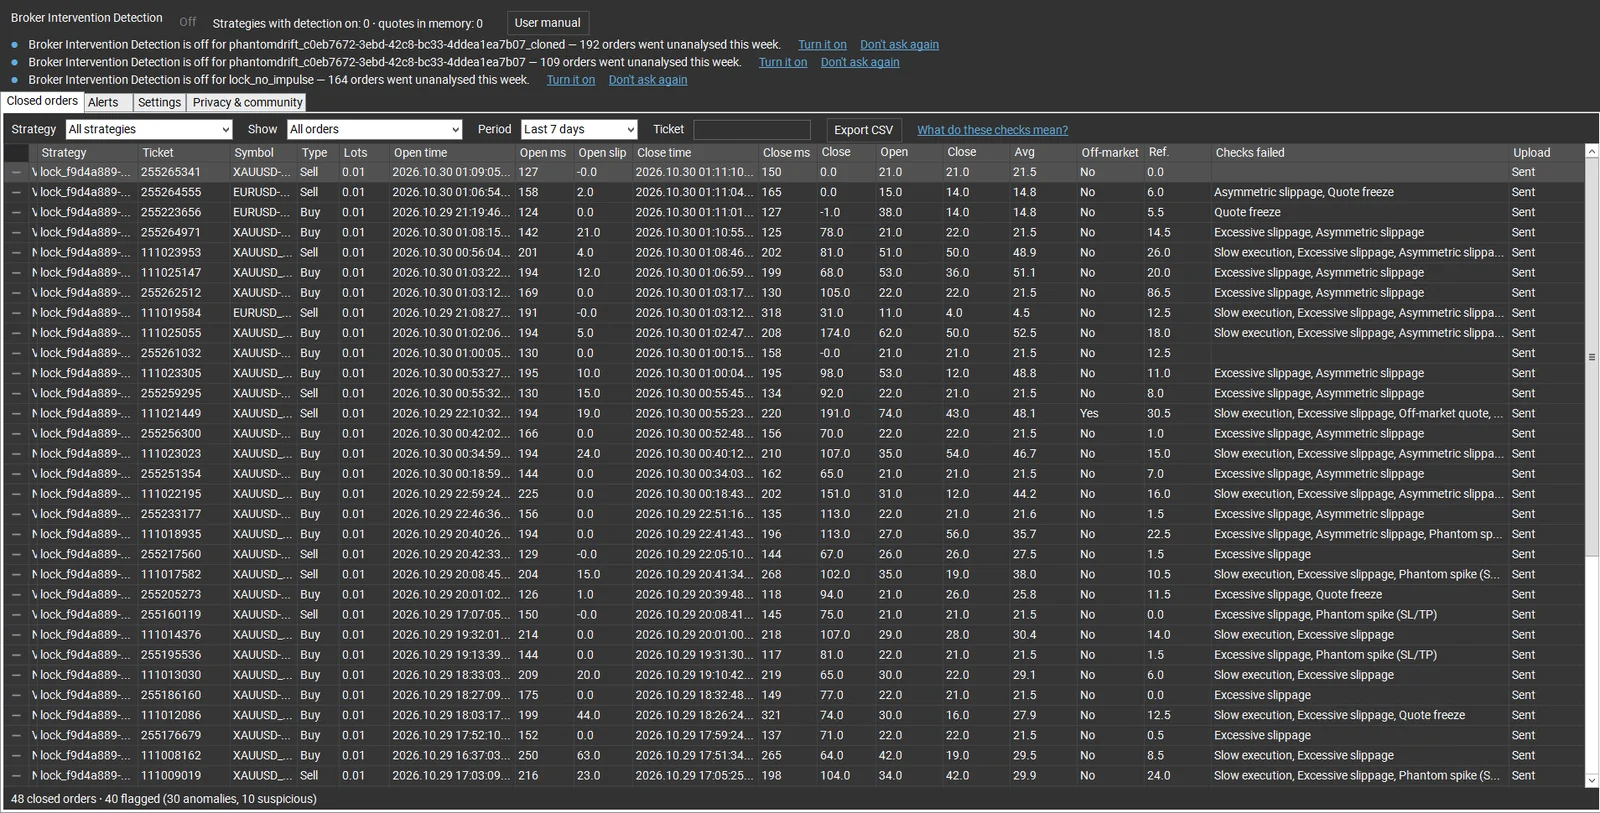
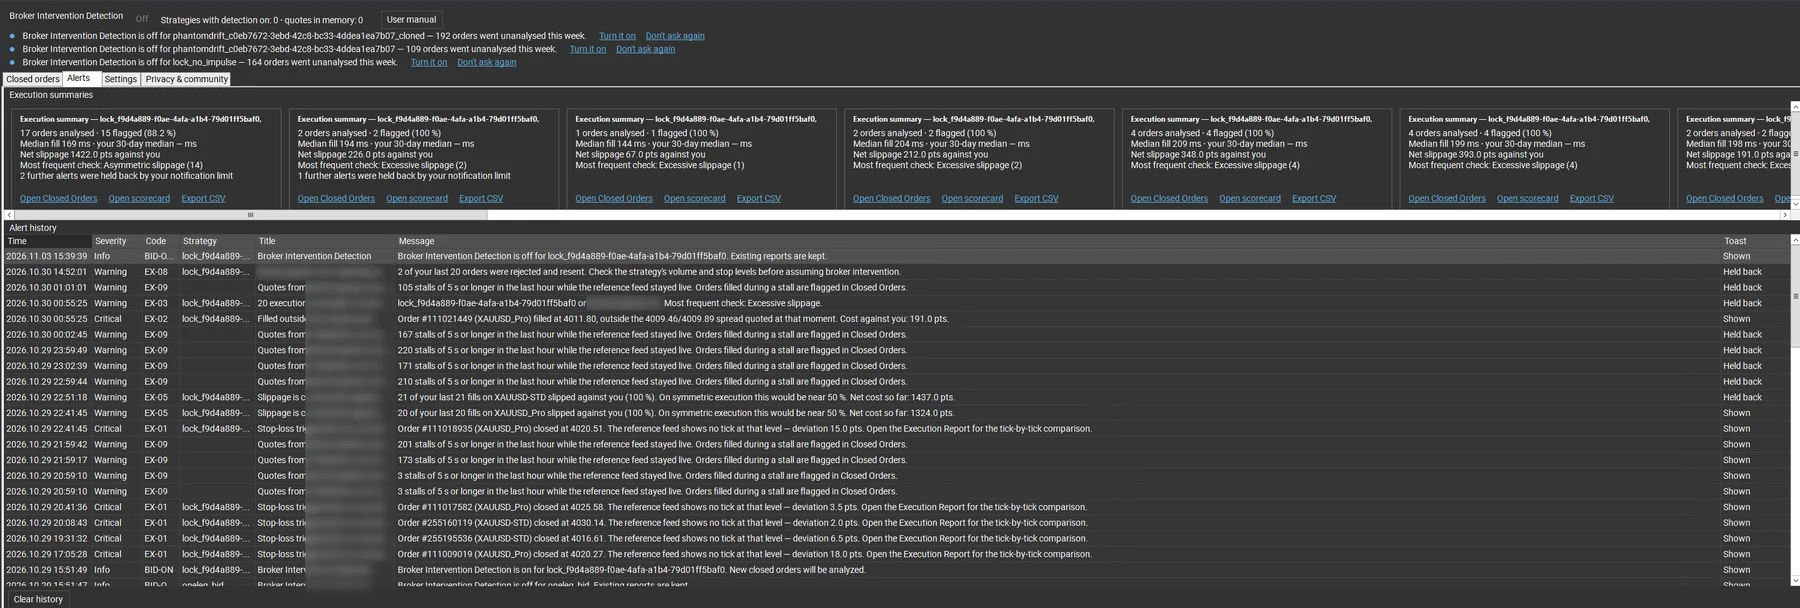
Video, 2:22: the module and the Scorecard in action.
Measure your broker before you scale up
Execution time, signed slippage, reference deviation and named checks for every order, plus the community comparison.
Limits and honest caveats
- An anomaly is not proof. Detection says the execution was abnormal by a clear definition, not that a broker broke a rule.
- Your setup matters. A distant VPS, packet loss or a drifting clock create slow fills and false flags. Check clock offset and ping first.
- Reference feeds are not identical to your broker’s liquidity. Small deviations are normal; the checks use thresholds for that reason.
- Markets are not always fair to anyone. Around major news, every broker slips and widens spreads. Judge brokers on normal hours and on patterns.
FAQ
What is good execution speed for forex?
For short-term strategies on a VPS near the broker’s server, a median fill under about 150 to 200 ms is typical, with a P95 not far above it. More important than the median is stability and symmetry: the same speed on opening and closing, for winning and losing trades.
Is negative slippage a sign of a bad broker?
Not on its own. Slippage happens in both directions on fair execution. It becomes a warning when most slipped fills go against you over a meaningful number of orders.
What is a phantom spike?
A short adverse price spike on your broker’s feed that no independent reference feed shows. If a stop-loss is triggered by such a spike, the stop was hit by a price that was never really traded elsewhere.
How many orders do I need before I can judge a broker?
For slippage direction, at least 30 to 50 slipped fills per symbol. For latency, a few dozen fills already show the typical time; the slow end needs more.
Can a broker detect that I measure execution?
Measuring is passive: it only reads your closed orders and quotes. It sends nothing to the broker and does not change how orders are placed.
Is it legal for a broker to delay or slip orders?
Rules depend on the regulator and the account agreement. Many agreements allow requotes and slippage in fast markets; one-sided treatment of profitable clients is a different matter. Keep per-order evidence and check your broker’s terms and regulator.
Trading involves risk. This guide is educational and not financial or legal advice. Detection results are diagnostic information, not proof of a broker breach.