 Deutsch
 日本語
日本語 العربية
 한국어
한국어 Español
 Português
 Indonesia
 Tiếng Việt
 中文
中文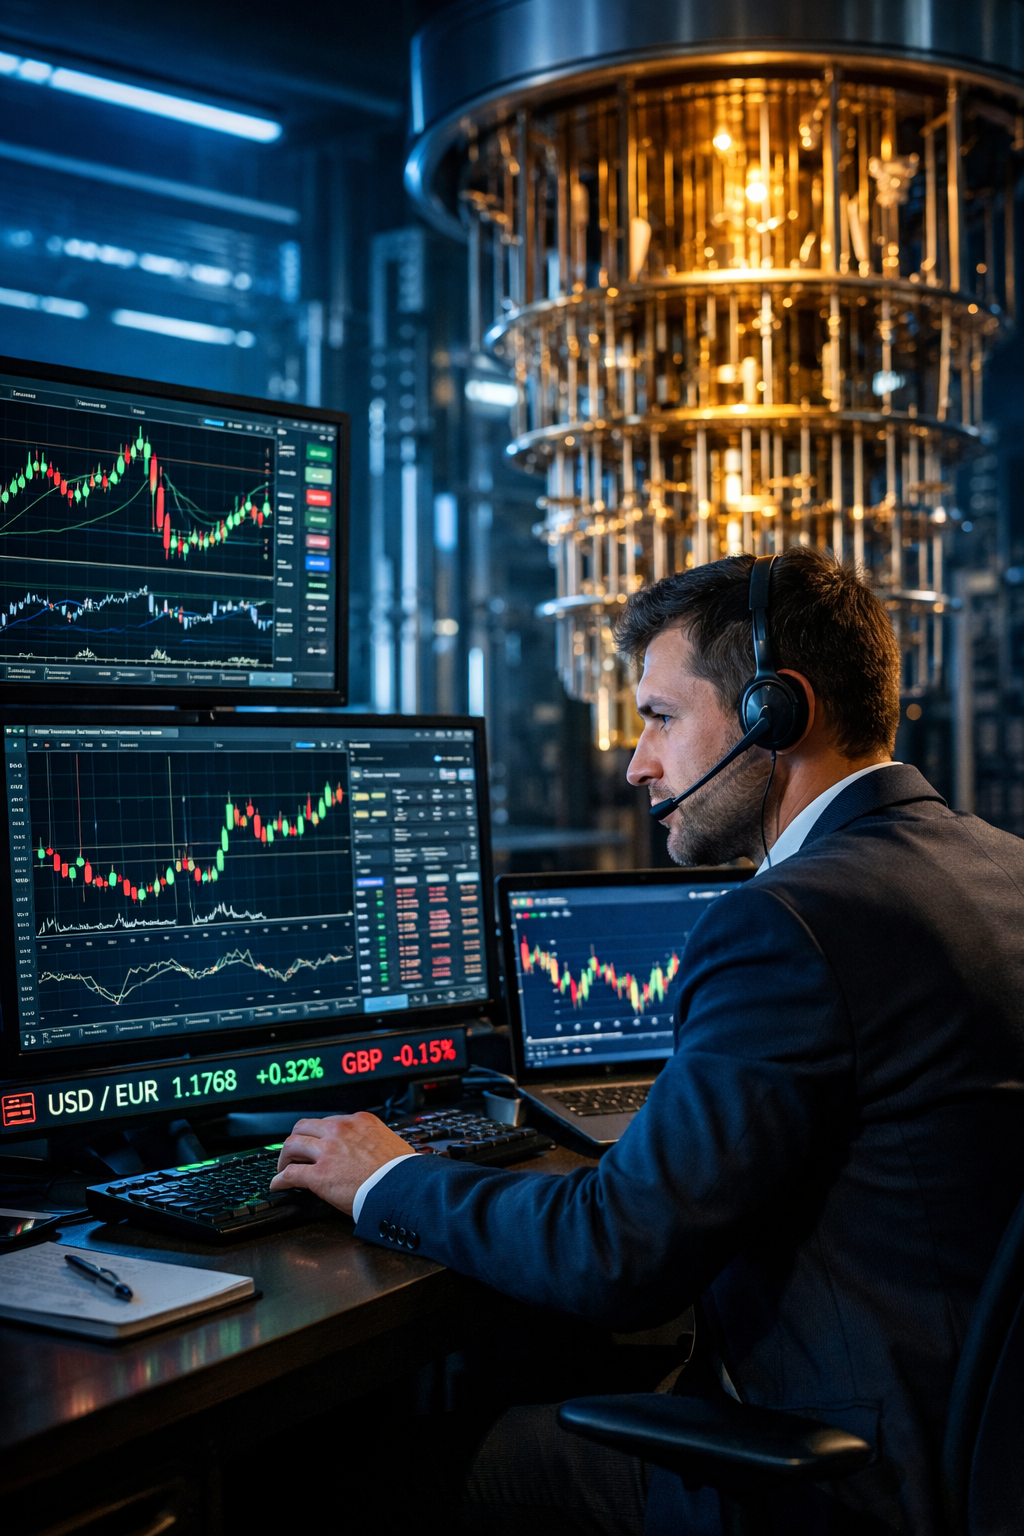
Non-Arbitrage Forex Robots: Strategies, Risks, and the Future 2027+ (AI, Quantum Methods, Blockchain Verification) Friday January 9th, 2026 – Posted in: Forex trading
Forex robots are typically classified into two broad categories: arbitrage and non-arbitrage.
Arbitrage attempts to extract profit from market inefficiencies (price discrepancies, latency, different feeds, execution differences).
Non-arbitrage robots generate profits differently: they look for recurring behavioral market patterns—trends, pullbacks, impulses, volatility cycles, and event-driven reactions.
That is why such systems are easier to deploy with most brokers and on different platforms, but they depend much more strongly on market phases and on competent risk management.
Below are the main types of non-arbitrage strategies, their advantages and limitations, and an honest comparison with arbitrage strategies.
1) Trend Following: Following the Trend
Essence:
The robot enters on a confirmed movement (range breakout, moving-average crossover, trend-strength filter) and holds the position while the trend persists. Trailing stops, partial profit-taking, and volatility filters are often used.
Commonly used indicators:
-
MA / EMA / SMA (crossovers, slope, distance from the mean)
-
ADX / DMI (trend strength)
-
MACD (momentum + direction filter)
-
Donchian Channels (breakout of extremes)
-
Parabolic SAR (trade management)
-
ATR (dynamic stops/trailing)
Pros:
-
capable of capturing large moves and “scaling” profits;
-
transparent logic, easy to test and scale;
-
lower risk of “averaging into infinity” compared to grids.
Cons:
-
A series of false entries is possible in a range of markets.
-
strongly dependent on spread/slippage on lower timeframes;
-
uneven profitability: periods of stagnation and drawdowns occur.
Comparison with arbitrage:
Trend following does not require ultra-low latency or “perfect execution,” but its profitability is payment for bearing market risk. Arbitrage more often aims for mechanical stability, but can be “broken” by execution rules.
2) Mean Reversion: Return to the Mean (Counter-Trend)
Essence:
Price often “overextends”; after an impulse, a pullback occurs. The robot sells overbought conditions and buys oversold ones, focusing on deviations from averages, VWAP, ranges, and statistical boundaries.
Commonly used indicators:
-
RSI / Stochastic (overbought/oversold)
-
Bollinger Bands (exit and return to bands)
-
VWAP / deviation from averages (distance-to-mean)
-
Z-score / standard deviation (statistical deviation from the mean)
-
CCI (cycles/overextensions)
-
ATR (filter “too noisy” conditions/stops)
Pros:
-
high trade frequency, many opportunities in calm markets;
-
Often produces a smooth equity curve in ranges.
-
quickly closes small profit targets.
Cons:
-
main risk is a prolonged trend against the position.
-
many implementations use averaging/grids → tail risk;
-
in crisis volatility, drawdowns can grow rapidly.
Comparison with arbitrage:
Mean reversion can look stable until the market changes regime. Arbitrage more often suffers from broker limitations, while counter-trend systems suffer from the nature of the market itself (regimes, tail moves).
3) Breakout / Momentum: Breakouts and Impulse
Essence:
If the market compresses for a long time and then exits a range, acceleration often follows. The robot trades breakouts using channels, levels, ATR filters, and “volatility compression.”
Commonly used indicators:
-
Donchian / Price Channels (range breakouts)
-
Bollinger Bands (compression/expansion, squeeze)
-
ATR (true breakout filter + stops)
-
Volume (if available) / tick volume (impulse confirmation)
-
MACD / Momentum (acceleration)
-
Keltner Channels (alternative to Bollinger Bands)
Pros:
-
effective during acceleration phases, can capture strong impulses;
-
suitable for many instruments and timeframes;
-
can work “near news” without trading the news directly.
Cons:
-
false breakouts and returns into the range;
-
slippage increases during volatility spikes;
-
requires disciplined filtering, otherwise too much noise.
Comparison with arbitrage:
Breakout strategies are simpler from an infrastructure standpoint but depend more heavily on liquidity regimes and execution quality at entry.
4) Scalping (Non-Arbitrage) and Micro-Patterns
Essence:
Very short trades on seconds or minutes, attempting to capture local impulses and fast pullbacks. This is not arbitrage because the signal is not based on price discrepancies — it is based on statistical price behavior.
Commonly used indicators:
-
EMA 5/10/20, fast moving averages (micro-trend direction)
-
RSI / Stochastic on low timeframes (micro overextensions)
-
ATR / micro-ATR (spike filtering)
-
Spread / commissions / execution speed as “strategy parameters” (sometimes more important than indicators)
-
Session filters (when spreads are tight and liquidity is high)
Pros:
-
high capital turnover;
-
possibility to build a portfolio of different micro-models;
-
with good execution, provides many trading opportunities.
Cons:
-
maximum sensitivity to spread, requotes, and latency;
-
any degradation of execution sharply reduces expectancy;
-
requires strict control of trade quality and filters.
Comparison with arbitrage:
In terms of execution requirements, scalping is close to arbitrage, but without a “hard” inefficiency as a profit source. Therefore, test quality and real execution statistics are critical.
5) Swing and Position-Trading Robots
Essence:
Holding trades from hours to days. Signals may include daily levels, macro filters, risk regimes, seasonality, and correlations.
Commonly used indicators:
-
MA 50/200, higher-timeframe trend filters
-
RSI(14) / MACD (cycle confirmation)
-
Fibonacci / levels/pivot points (reaction zones)
-
ATR (volatility-based stops)
-
Correlations / DXY / yields (if integrated into the system)
Pros:
-
spread and micro-price noise matter less;
-
lower requirements for speed and infrastructure;
-
a good option for diversifying a strategy portfolio.
Cons:
-
gap risk and unexpected events;
-
swaps / cost of holding positions;
-
long drawdowns and slow recovery cycles.
Comparison with arbitrage:
Lower technological requirements, but more “pure market risk” and higher demands on investor patience.
6) Grid Systems (Grid Robots)
Essence:
The robot places a series of orders/positions at fixed or adaptive intervals (grid step), exploiting oscillations within a range. Can be:
-
fixed grid (equal step),
-
adaptive grid (step depends on ATR / volatility),
-
with or without lock, with basket-level take-profits.
Commonly used indicators:
-
ATR (step width, grid expansion/contraction)
-
Bollinger Bands / Keltner Channels (range boundaries)
-
RSI / Stochastic (entry filter to avoid starting a grid during acceleration)
-
Trend filters (MA / ADX) — the most important, to avoid trading grids in strong trends
Pros:
In calm ranges, it can generate frequent profits and a visually attractive equity curve.
Cons:
The main risk is a strong one-directional trend, during which the grid accumulates losses.
Compared to arbitrage:
A grid does not require speed, but carries structural tail risk (rare, but extremely painful).
7) Martingale
Essence:
Increasing position size after a loss (often x2 or by a coefficient) to “quickly recover” to profit on a pullback. Can be used standalone, but is more often embedded in grids or averaging systems.
Commonly used indicators (as filters):
-
RSI / Stochastic / CCI (to “average only at overextensions”)
-
ATR (volatility limits)
-
MA / ADX (blocking martingale in strong trends)
-
News/time filters (do not average before news / in thin markets)
Pros:
Quickly recovers drawdowns if the market retraces.
Cons:
Mathematically shifts risk into the tail of the distribution: rare scenarios produce massive losses or margin calls.
Compared to arbitrage:
Arbitrage more often has “external” risks (broker rules), while martingale has risk embedded in its very structure.
Important Clarification
Grid ≠ Martingale, but:
-
grids often average positions,
-
martingale often increases the lot size during averaging,
So in practice, they are often confused and combined.
8) Volatility Strategies (Volatility / Regime Trading)
Commonly used indicators:
-
ATR, Historical Volatility (HV) (regime measurement)
-
Bollinger Band Width (band width as a volatility proxy)
-
ADX (distinguishing trend from noise)
-
Range / True Range metrics (daily / session range)
-
Time / session filters (London / New York / Asia)
Strengths:
Effectively manages robot activity (when to trade and when to “stay idle”).
Weaknesses:
It is difficult to select stable thresholds; the volatility structure can shift.
Compared to arbitrage:
This is an “intelligent filter,” but it does not guarantee profitability on its own.
Which Is Better: Arbitrage or Non-Arbitrage?
The correct answer is: it depends on the goals and the environment.
Arbitrage often appears more attractive due to the notion of “almost mechanical” profit, but it is vulnerable to broker policies such as last look, delays, trade cancellations, spread widening, and restrictions on trading style.
Non-arbitrage robots can operate with a much larger number of brokers and are easier to scale, but their profits are compensated for exposure to market regime risk. Therefore, without adaptation and risk mitigation, they inevitably experience difficult periods.
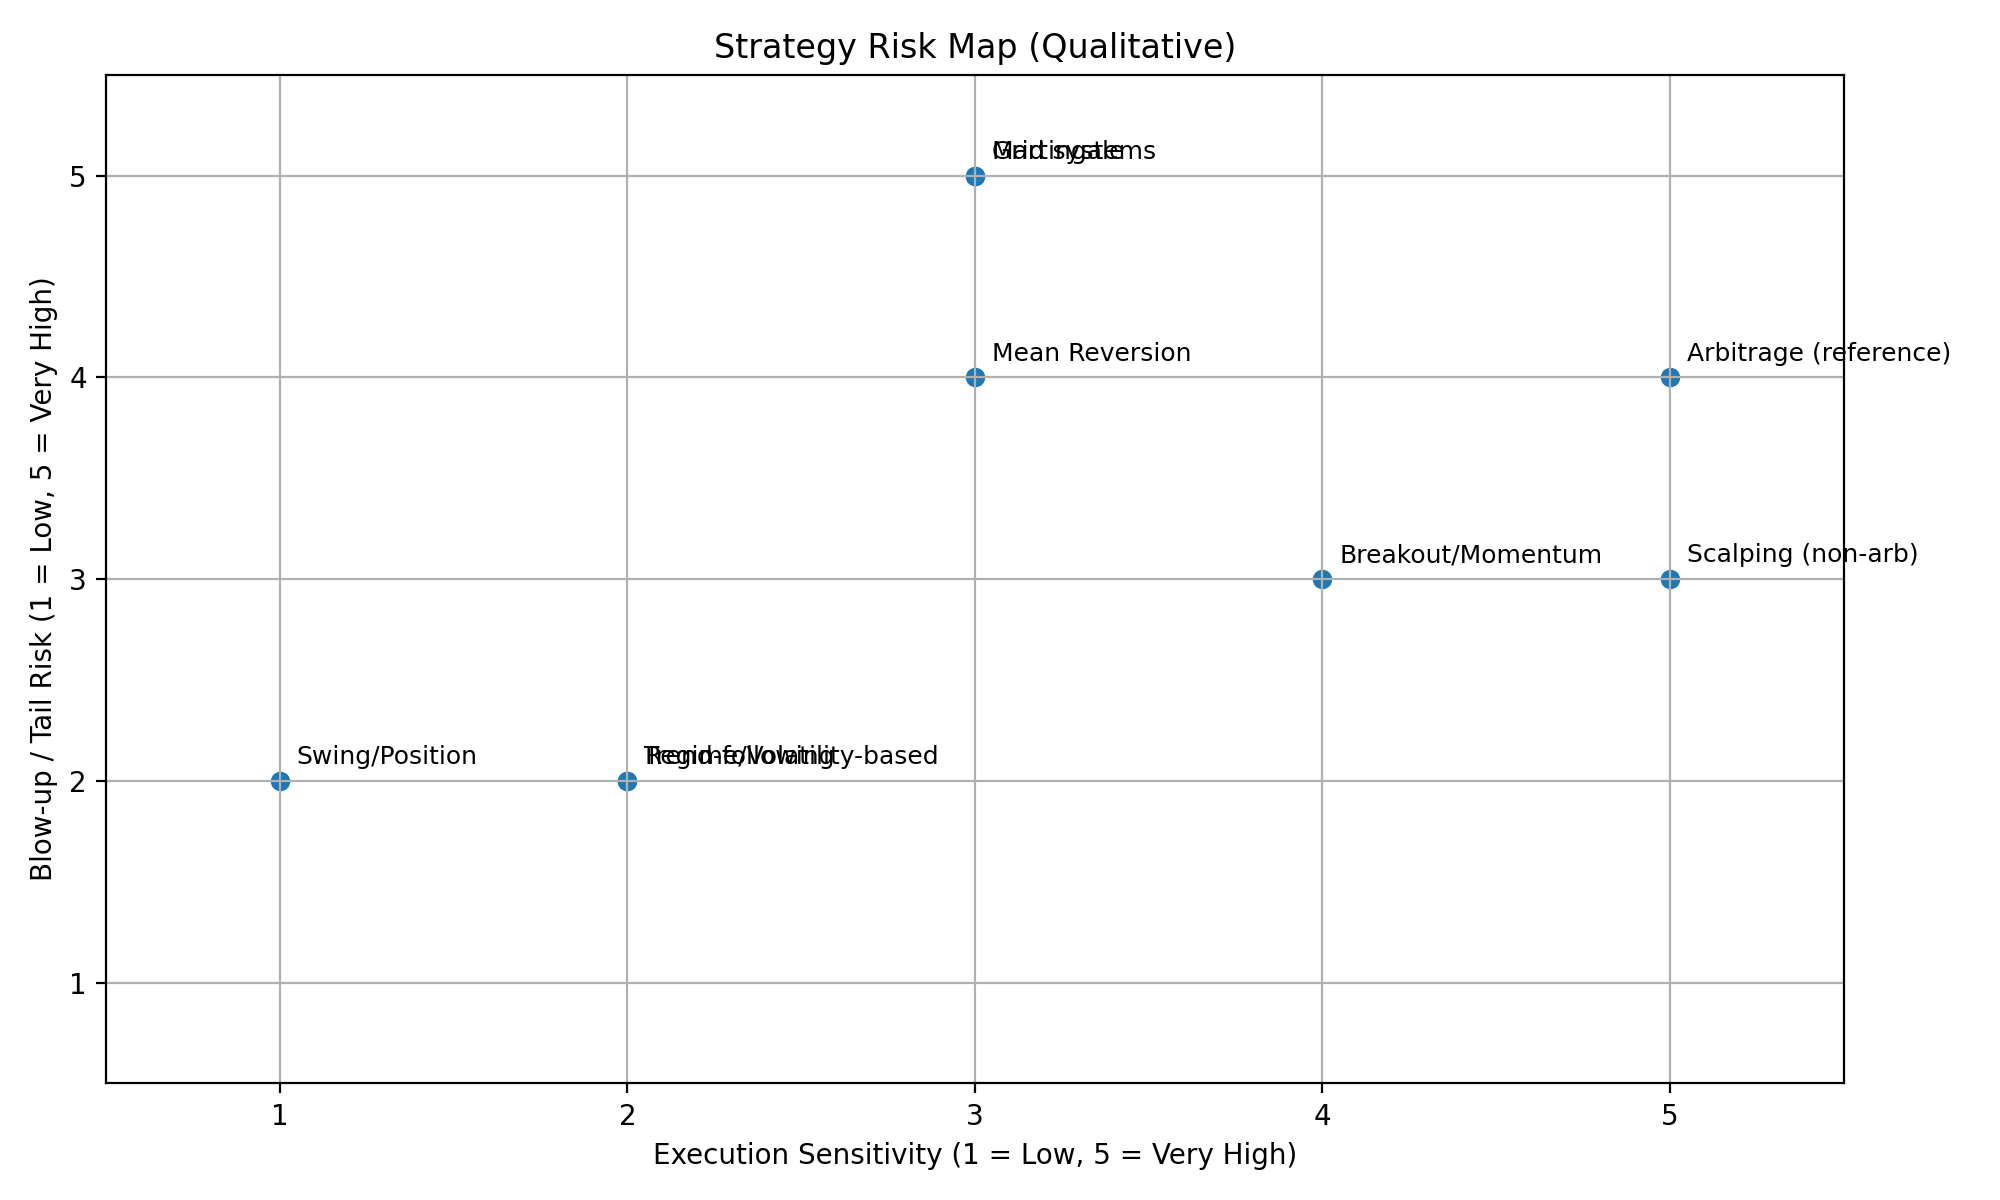
| Strategy | Best market conditions | Common indicators/filters | Main advantage | Main drawback | Compared to arbitrage (one line) |
|---|---|---|---|---|---|
| Trend-following | Trending markets | Moving Averages (SMA/EMA), ADX, MACD, Donchian Channels, ATR | Captures big directional moves | Choppy losses in ranges | Much easier infrastructure-wise, but highly regime-dependent |
| Mean Reversion | Ranges / sideways markets | RSI, Stochastic, Bollinger Bands, VWAP, Z-score, ATR | Frequent wins in calm ranges | Tail risk in strong trends | Usually broker-friendly, but can break when regime shifts |
| Breakout / Momentum | Expansions, range breaks, impulse phases | Price Channels, Bollinger “squeeze”, ATR, Momentum, Tick Volume | Catches acceleration and strong moves | False breakouts and slippage | No special feed needed like arbitrage, but entry execution is critical |
| Regime / Volatility-based | Regime transitions | ATR / Historical Volatility, Bollinger Band Width, ADX, Range filters, Session filters | Reduces “bad” trades and improves robustness | Misclassification of regimes | Improves stability without arbitrage’s latency dependence |
| Scalping (non-arbitrage) | High liquidity, tight spreads | Fast EMAs, RSI/Stoch (M1), Micro-ATR, Spread/Session filters | Many trade opportunities | Spread/slippage can kill the edge | Execution requirements can resemble arbitrage, but the edge is less “hard” |
| Swing / Position trading | H4–D1 cycles and macro moves | MA 50/200, MACD, RSI, Levels/Pivots, ATR | Lower sensitivity to spread | Gaps, swaps, longer drawdowns | Technically simpler than arbitrage, but more event risk over time |
| Grid systems | Sideways / range-bound | ATR (grid step), Bollinger/Keltner, RSI/Stoch, MA/ADX trend filter | Often smooth results in ranges | Trend against the grid can be brutal | No speed required, but tail risk is higher |
| Martingale | Limited use; only with strict constraints | RSI/Stoch/CCI, ATR limits, MA/ADX, News/Time filters | Fast recovery after losses (if reversals occur) | Exponential risk, margin call potential | Arbitrage often has “external” risks; here the risk is built into the math |
| Arbitrage (reference) | Pricing/latency inefficiencies | Feeds, latency metrics, spread/execution filters | Mechanically driven edge | Broker restrictions (last look, cancels, delays) | Requires infrastructure and can be limited by execution policies |
At the moment, one of the most effective ways to balance risk and profitability is to combine arbitrage and non-arbitrage approaches within the same portfolio—or even inside the same execution framework. A practical example is Sharp Trading’s implementation of the Phantom Drift concept, which blends Martingale-style position management with Latency Arbitrage logic. This hybrid structure helps reduce key weaknesses of pure arbitrage—especially its sensitivity to execution rules and the risk of being flagged by dealing teams at brokers or prop firms—while improving overall profitability and smoothing the equity curve by reducing the probability of deep, strategy-killing drawdowns.
Additionally, SharpTrader can be enhanced with the Hybrid Masking Strategy add-on, designed to make arbitrage behavior appear more “human” and harder to pattern-match. It combines multi-timeframe EMA trend logic with Fibonacci pullback entries, and adds multiple layers of randomization (timing, trade size, SL/TP behavior, trailing, order lifetime), with optional news filtering—so the execution footprint becomes more natural and less deterministic for broker surveillance systems.
The Future: AI/ML, Neural Networks, and a Regime-Based Approach (Trend / Range / Crisis)
The main trend for 2026+ is the transition from “one strategy for everything” to a system of systems that understands what kind of market is present and changes its behavior accordingly:
1. Regime Classification
The model identifies the environment: trend, range, crisis volatility (risk-off), and sometimes a “news impulse.” This reduces the number of trades taken at the wrong time.
2. Adaptive Learning
Parameters are not fixed forever. Walk-forward methods, periodic reweighting, overfitting control, and monitoring of signal-quality degradation are employed.
3. Predictive Probability Analysis
Modern models more often predict not a “price at a point,” but probabilities: direction over a given horizon, expected volatility, tail-move risk, and entry quality.
4. Neural Networks and Model Ensembles
Neural networks (and hybrid ensembles) detect complex patterns, but they require strict rules: clean data, no leakage, honest testing, realistic slippage, and commissions.
The overall development vector is clear: winners are those who build a portfolio of strategies, manage regimes and risk, and measure execution quality in real time. In a world where markets change faster than “classical” algorithms are updated, competitive advantage shifts from the “signal” itself to adaptation.
The Future: 2027+ — Quantum Trading, Blockchain Verification, and Fully Autonomous Systems
Starting in 2027, the development of non-arbitrage trading robots will be driven less by “new indicators” than by infrastructure and computation: the ability to process more data, adapt faster to market regimes, and verify results more rigorously. Three directions look the most promising.
1) Quantum Trading and Quantum-Inspired Methods
By “quantum trading,” most people will not mean a magical button, but a practical transition to tasks where quantum or quantum-inspired algorithms provide an advantage:
-
optimization of strategy portfolios (how to allocate risk between trend, mean reversion, volatility, different pairs, and timeframes);
-
combinatorial problems (parameter selection, trading session schedules, risk constraints);
-
acceleration of scenario analysis (running large numbers of stress scenarios and market regimes);
-
searching for weak but stable patterns in huge feature spaces where classical methods are too slow.
Important: quantum computing does not eliminate market risk and does not guarantee profit. Its real value lies in faster discovery of optimal configurations and more precise regime and risk tuning when a system has thousands of parameters and constraints.
2) Blockchain Verification of Results and “Provable” Statistics
The next step for the industry is moving away from marketing reports toward cryptographically verifiable results. Standards will emerge where:
-
trading logs, key metrics, and risk parameters are recorded as hashes on a blockchain (or another immutable database);
-
an investor or client can verify that a report was not rewritten retroactively and that the performance history is immutable;
-
a provider can prove the origin of statistics: real trades, a real broker, real execution time — without disclosing all sensitive information.
This will increase trust in robots and make it harder to sell “painted” equity curves. In practice, the market will move toward the model: do not trust words — verify proofs.
3) Fully Autonomous Systems (Zero Human Intervention)
By 2027+, the most competitive robots will become closer to autonomous “managers,” with humans not intervening in trading decisions. In such an architecture, the key is not entry or exit, but self-governance:
-
automatic regime detection (trend/range/crisis) and logic switching;
-
dynamic risk management (risk reduction when signals degrade, drawdown limits, module shutdowns);
-
self-monitoring of execution quality (spread/slippage/latency → the system reduces activity or changes style on its own);
-
bounded self-learning (parameter adaptation without overfitting, with “guardrails” and protection against drift);
-
emergency protocols: during atypical volatility, liquidity gaps, or technical failures, the robot moves into a safe mode.
The ideal goal of zero human intervention is for the robot not just to trade, but to manage its own viability: to understand when it is not in shape and to be able to stop itself.
Final Conclusion
The future of 2027+ is not about “the smartest signal,” but about a combination of three factors:
ultra-efficient optimization (including quantum-inspired approaches), provably honest results (blockchain verification), and an autonomous architecture that enables the system to adapt and protect capital without manual intervention.
FAQ: Non-Arbitrage Forex Robots
1) What is a non-arbitrage Forex robot?
It is a robot that earns not from price inefficiencies (as arbitrage does), but from market regularities: trends, pullbacks, impulses, volatility, market regimes, and liquidity behavior.
2) How do non-arbitrage robots differ from arbitrage robots in essence?
Arbitrage seeks a “mistake” in pricing or execution and often depends on speed and broker-specific features. Non-arbitrage robots take market risk and attempt to exploit statistical edges from repeating patterns.
3) Which strategy is the “safest”?
There are no absolutely safe strategies. Swing and position-based models with moderate leverage and limited risk per trade are usually considered “softer,” but they can experience long drawdowns.
4) Why did the strategy work well in the tester but worse on a live account?
Most often because of slippage, commissions, spread, delays, differences in quotes, requotes or partial fills, and tester “idealization.” This is especially noticeable in scalping and high-frequency systems.
5) What is more important: entry accuracy or risk management?
Risk management. A good entry without risk control can still lead to a large drawdown, while a moderate system with proper risk control survives regime changes much better.
6) Which non-arbitrage strategies are most common?
Trend following, mean reversion (counter-trend / return to the mean), breakout/momentum, scalping on micro-patterns, and swing / position systems.
7) Why are counter-trend strategies and grids so popular — and why are they dangerous?
Because they often produce attractive statistics in calm markets. However, they have “tail risk”: rare but very severe moves against the position, especially with averaging or martingale.
8) Is it realistic to earn consistently with trend-following robots?
Yes, but profitability is usually “step-like”: periods of profit are followed by periods of chop or drawdown. One must accept unevenness and properly configure filters, stop-losses, and position sizing.
9) Which timeframes are best for non-arbitrage robots?
It depends on the type. Scalping — M1–M5, trend or breakout — M15–H4, swing — H4–D1. The lower the timeframe, the stronger the impact of spread and execution quality.
10) How can you tell that a robot has “caught the wrong market regime”?
Signals include a sharp increase in consecutive losing trades, higher average slippage, changes in volatility, reduced trendiness, changes in instrument correlations — while the strategy continues trading “as before.”
11) Can AI or neural networks be used to simply “predict price”?
They can, but it is often more effective to predict probabilities rather than price itself: direction, expected volatility, tail-move risk, and entry quality. “Direct price prediction” often overfits.
12) What is a regime-based robot (trend / flat / crisis) and why is it needed?
It is a system that first determines the market state (trend, range, crisis volatility) and then selects the appropriate trading logic or reduces activity. This helps avoid trading in “the wrong weather.”
13) How can overfitting be avoided during optimization?
By using walk-forward analysis, separating data into in-sample and out-of-sample sets, stress testing, realistic modeling of commissions and slippage, limiting the number of parameters, and testing across different instruments and periods.
14) What is better: a single robot or a portfolio of robots?
A portfolio is almost always more resilient: different strategies perform better in different regimes. A combination of trend, mean reversion, and “volatility” usually reduces drawdowns and smooths results.
15) What are the signs of a “bad” robot or robot seller?
Guaranteed returns, lack of real execution statistics, hidden martingale or averaging without limits, no clear risk disclosure, tests on only one period, ignoring commissions or slippage, and “perfect” curves without explanation.
16) What does “quantum trading” mean in a real sense, without marketing?
It means using quantum or quantum-inspired methods for optimization and solution-search tasks, including risk allocation across strategies, parameter selection, and scenario analysis. It is mostly about computational acceleration and optimization, not “guessing price.”
17) Is it true that quantum computers will provide guaranteed profit?
No. They do not eliminate market risk. The potential advantage is faster discovery of more robust strategy portfolio configurations and more precise adaptation to market regimes.
18) Which trading tasks may benefit first from quantum methods?
Combinatorial optimization (strategy portfolios, risk constraints), fast simulation of large numbers of stress scenarios, and searching for weak patterns in very large feature spaces.
19) What is blockchain verification of a robot’s results?
It is the fixation of key data (or their hashes) in an immutable system to prove that reports were not “redrawn after the fact” and that statistics correspond to real logs and trades.
20) Does this mean trading data will become public?
Not necessarily. Usually, not the trades themselves are published, but cryptographic “fingerprints” (hashes) and integrity proofs. Details can remain private yet verifiable.
21) Why does the market need such verification at all?
To increase trust and standardize provable results. This reduces the share of “pretty charts without real execution” and makes robot comparisons more honest.
22) What is a fully autonomous robot (zero human intervention)?
It is a system that does not require manual intervention: it independently determines market regimes, adjusts risk, controls execution quality, can disable modules, and switch to safe mode under abnormal conditions.
23) What are the risks of zero human intervention systems?
The main risks are incorrect adaptation (overfitting or drift), misclassification of the regime, and technological failures (data, connectivity, latency). That is why “guardrails” are critical: risk limits, fail-safe modes, and degradation monitoring.
24) How can you tell that a robot is truly autonomous and not just “marketed as such”?
Look for signs such as automatic risk reduction when metrics deteriorate, an event log (why a module was enabled or disabled), emergency stop rules, execution monitoring (spread and slippage), and reporting by market regime.
25) How will robot testing requirements change in 2027+?
Testing will become closer to engineering: mandatory stress tests, validation across different regimes, realistic execution modeling, and increasingly, external verification of results (including cryptographic verification) instead of “tester screenshots.”