 English
 Deutsch
 日本語
日本語 한국어
한국어 Español
 Português
 Indonesia
 Tiếng Việt
 中文
中文

ما وراء الساعة: الزمن غير الخطي ومستقبل تداول الفوركس 29/04/2025 – Posted in: Forex trading
عندما كنت في الثامنة عشرة من عمري، ذهبت مع بعض الأصدقاء لصيد الأسماك.
في الطريق، انفجر أحد إطارات السيارة. انقلبت السيارة عدة مرات على الطريق وسقطت في حفرة بجانب الطريق.
كنا محظوظين — لم يصب أي منا بأذى.
ولكن في الأحاديث التي تلت ذلك، تذكرنا جميعًا أن لحظة الحادث بدت طويلة بشكل لا يصدق بالنسبة لنا، رغم أن كل شيء حدث خلال ثوانٍ معدودة من منظور أي مراقب خارجي.
هذا الظاهرة يصفها كثير من الأشخاص الذين يمرون بمواقف حرجة أو مهددة للحياة.
يشعر الأمر كما لو أن الزمن نفسه يتباطأ.
نحن معتادون على التفكير بالزمن كبُعد خطي، ولكن وفقًا لـنظرية النسبية الخاصة، فإن الزمن غير خطي.
إذاً، السؤال هو: كيف يمكننا تطبيق هذا الفهم على تداول الفوركس؟
الزمن غير الخطي في تداول الفوركس
الساعات في الأجسام المتحركة تدق أبطأ مقارنة بالأجسام الثابتة (نظرية النسبية الخاصة)
📘 علميًا:
إذا تحرك جسم بسرعة عالية (خاصةً بالقرب من سرعة الضوء)، فإن:
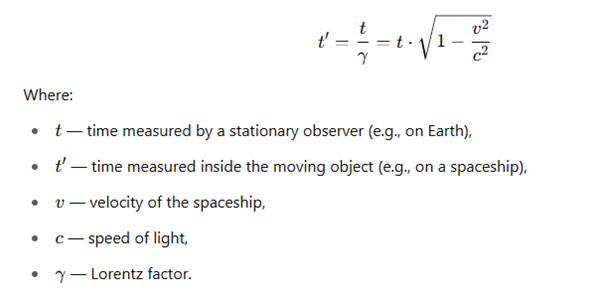
👉 كلما تحرك الجسم أسرع، كلما مر الزمن أبطأ بالنسبة له مقارنة بمراقب ثابت.
⏰ بديهياً:
لو كنت داخل مركبة فضائية تسافر بسرعة 99.999% من سرعة الضوء،
ستمر ساعة واحدة عليك،
في حين أن عشر سنوات ستمر على الأرض.
بمعنى آخر، أنت “تقطع عبر الزمن”.
📈 تشبيه بالتداول:
تخيل سوقًا ترتفع فيه الأسعار بسرعة صاروخية.
- في تلك اللحظة، يُضغط الزمن السوقي — كل شيء يحدث بسرعة.
- بالنسبة للمتداولين داخل الحركة، يبدو الزمن “طبيعيًا”.
- للمراقبين من الخارج، يبدو الأمر كوميض مفاجئ.
🔵 دافع سوقي قوي = صاروخ في النسبية.
🔵 الزمن داخل الحركة يتباطأ مقارنةً بالخارج.
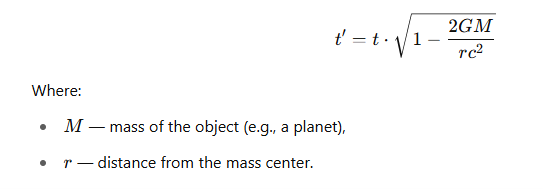
الزمن يتباطأ بالقرب من الأجسام الضخمة
(🌌 نظرية النسبية العامة)
📘 علميًا:
الجاذبية ليست قوة بحد ذاتها — بل هي انحناء للزمكان تسببه الكتلة.
كلما اقتربت من جسم ضخم (مثل ثقب أسود)، كلما تباطأ الزمن بالنسبة لك.
⏰ بديهياً:
- في مدار الأرض، يتدفق الزمن أسرع من سطحها.
- بالقرب من ثقب أسود، يكاد الزمن أن يتوقف.
بالنسبة للمراقبين من الخارج، تبدو الأجسام وكأنها “تتجمد” عند أفق الحدث، رغم أن الزمن بداخلها يبدو طبيعياً.
📈 تشبيه بالتداول:
الأجسام ذات الجاذبية الهائلة = أحداث السوق الكبرى (مثل تقارير NFP، اجتماعات FOMC، الصدمات الجيوسياسية).
عند اقتراب السوق من مثل هذه الأحداث:
- يتباطأ تحرك السعر (توقعًا)،
- يتقلص الحجم (المتداولون يتجمدون)،
- يتمدد الزمن السوقي، كما لو أن الواقع نفسه “يتوقف”.
ثم بعد الحدث — ينفجر الزمن السوقي وتزداد الحركة بعنف.
🧠 جدول تلخيصي — الفيزياء مقابل التداول:
| مفهوم فيزيائي | تشبيه بالتداول |
|---|---|
| 🚀 حركة سريعة | دافع سوقي، اختراق سعري، حدث إخباري |
| ⌛ تمدد الزمن (تباطؤ) | أسواق مستقرة، تراكم مراكز، انتظار الأخبار |
| 🌌 الجاذبية | تأثير اللاعبين الكبار أو العوامل الأساسية |
| 📉 تشويه الزمن | توسع ATR، انفجارات تقلب، زمن سوقي غير خطي |
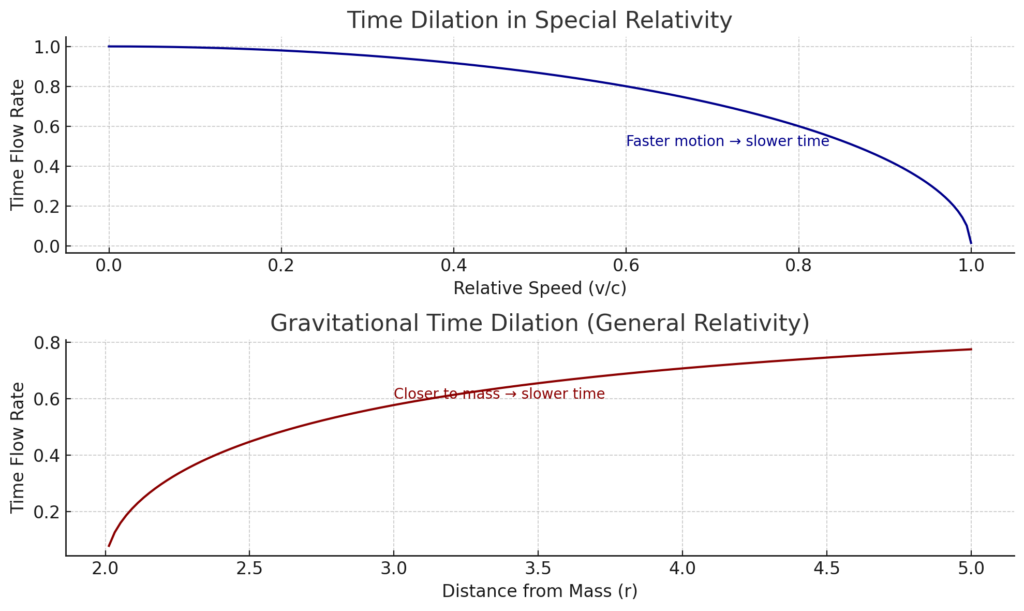
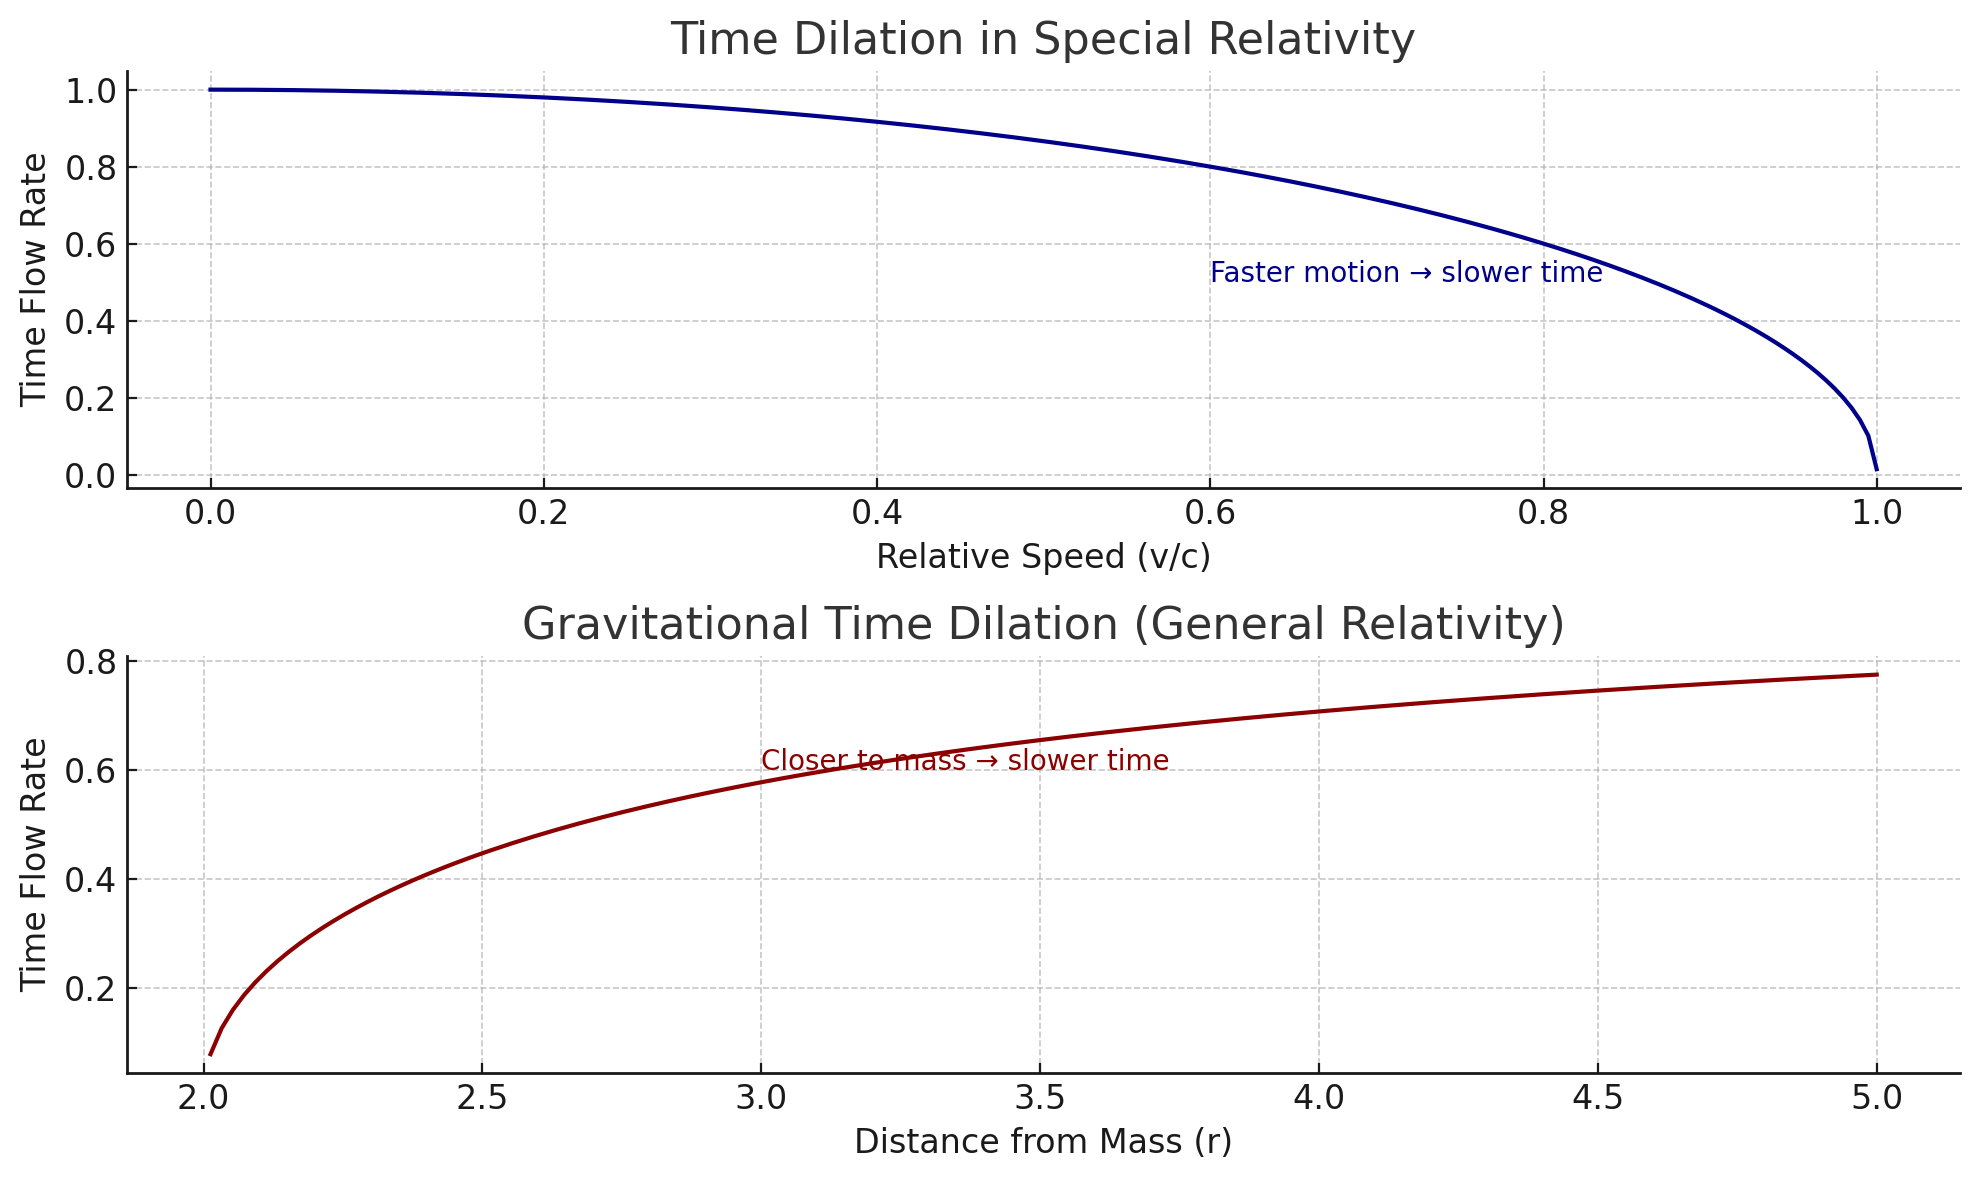
هنا تجد شرحًا بصريًا لكيفية تصرف الزمن بشكل غير خطي في الفيزياء — وكيف يرتبط ذلك بالتداول:
🔷 المخطط 1: النسبية الخاصة — السرعة تبطئ الزمن
- كلما زادت سرعة الجسم (اقترب من سرعة الضوء)، تتباطأ تدفقات الزمن بالنسبة لمراقب ثابت.
- في التداول:
📈 حركات السوق السريعة (دوافع) تضغط الزمن للمشاركين داخل الحركة — كل شيء يبدو سريعًا لكن سلسًا.
🔴 المخطط 2: النسبية العامة — الجاذبية تبطئ الزمن
- كلما اقترب جسم من كتلة جاذبية، يتباطأ الزمن نتيجة لانحناء الزمكان.
- في التداول:
🧲 الأحداث الاقتصادية الكبرى (NFP، FOMC، المخاطر الجيوسياسية) تعمل كآبار جاذبية.
يتباطأ السوق، يتجمد، يتراكم الضغط — يتمدد الزمن بينما ينكمش التقلب.
💡 مثال على الزمن غير الخطي في تداول الفوركس
تخيل رسم بياني لزوج EUR/USD لمدة 10 دقائق:
- لمدة 9 دقائق، يبقى السوق مسطحًا (يتذبذب السعر ضمن 3 نقاط فقط)،
- ثم في دقيقة واحدة، يحدث ارتفاع مفاجئ في التقلب (بسبب الأخبار) ويقفز السعر 30 نقطة.
⏰ في الزمن الخطي:
- تُعامل الدقائق العشر جميعها على قدم المساواة من حيث الأهمية.
- المؤشرات مثل SMA وRSI وMACD تقوم فقط بمتوسط الحركات دون تمييز تأثيرها الحقيقي.
🌀 في “الزمن السوقي” (الزمن غير الخطي):
- يتم ضغط الدقائق التسع المسطحة — تقريبًا بلا طول.
- تتمدد الدقيقة الواحدة ذات التقلب العالي — كما لو أنها استمرت ليوم كامل.
- تتباطأ المؤشرات خلال الفترة المسطحة وتسرع خلال الانفجار السعري.
📊 تشبيه فيزيائي:
في النسبية الخاصة:
- الساعات في الأجسام المتحركة بسرعة تدق أبطأ مقارنة بالمراقبين الثابتين.
في النسبية العامة:
- الزمن يتمدد بالقرب من الأجسام الضخمة (تمدد الزمن الجاذبي).
وفي التداول:
- السوق المسطح يتصرف كجسم ثابت → الزمن يتوقف تقريبًا.
- الدافع السعري كأنه قفزة عبر الفضاء الفائق → الزمن يطير.
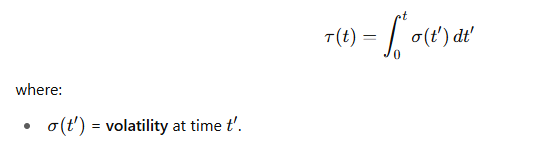
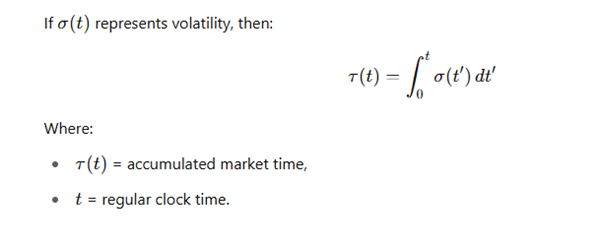
🔍 معادلة الزمن السوقي:
📏 مثال رقمي:
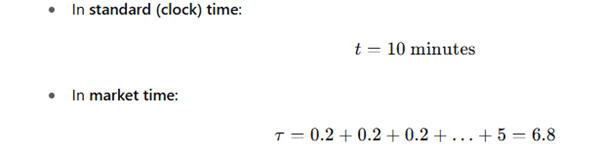
تلك الدقيقة الواحدة ذات التقلب تحوي “وزنًا” أكبر بكثير من التسع دقائق الهادئة.
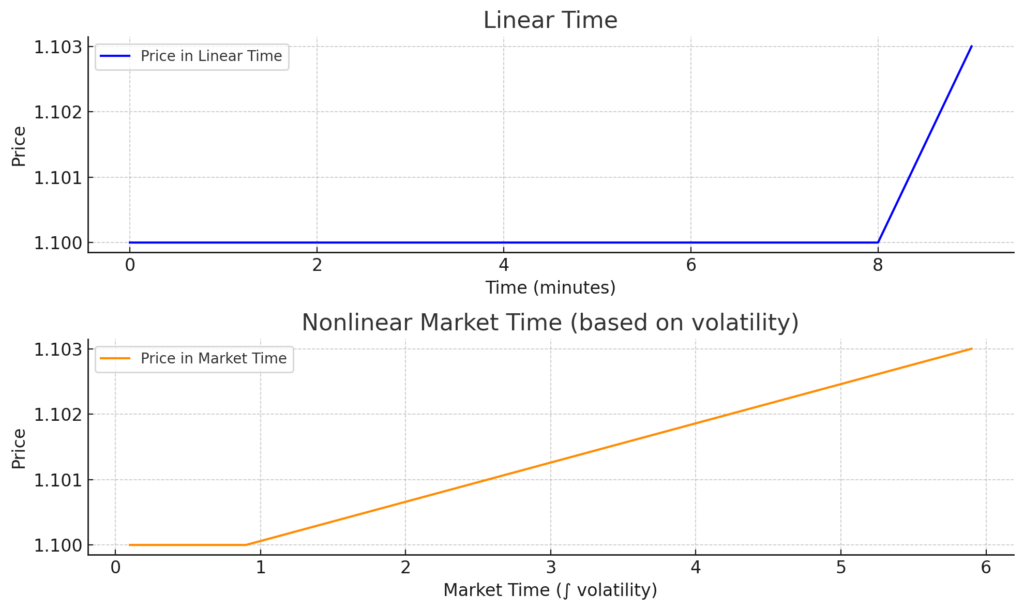
ها هو عرض بصري للزمن غير الخطي في التداول:
🔷 المخطط العلوي: الزمن الخطي
- يُعامل كل دقيقة بشكل متساوٍ.
- يظهر السعر مسطحًا لمدة 9 دقائق، ثم يقفز بشكل حاد في الدقيقة الأخيرة.
🟠 المخطط السفلي: الزمن السوقي غير الخطي
- يتمدد الزمن بناءً على التقلب (نشاط السوق).
- تتمدد الدقيقة الأخيرة ذات التقلب العالي، بينما تنضغط الفترات المسطحة.
- يحاكي هذا الزمن النسبي: المزيد من الحركة = المزيد من “الزمن المُعاش”.
🧠 عمليًا، المؤشرات المبنية على زمن السوق بدلًا من الزمن الخطي:
- تستجيب بشكل أسرع للتغيرات المهمة.
- تتجاهل المناطق المسطحة قليلة المعلومات.
- تعكس بشكل أفضل كيف “يشعر” المتداولون بالزمن أثناء فترات التقلب العالي.
🔍 مشكلة مؤشرات الفوركس الفنية التقليدية
المؤشرات مثل RSI، MACD، والمتوسطات المتحركة:
- تفترض وجود زمن خطي ومطلق،
- تعمل على مقياس ثابت (بار 1، بار 2، بار 3…)،
- لا تتكيف مع “الانضغاطات” أو “التمددات” السوقية.
📌 في الواقع، السوق يعيش وفق زمن غير خطي:
- أحيانًا، 5 دقائق تعادل ساعة كاملة (تقلب عالي)،
- وفي أوقات أخرى، 3 أيام تمر كظل (سوق مسطح منخفض التقلب).
🚀 ماذا لو طبقنا منهجًا نسبيًا؟
🔸 الفكرة: اعتبر السوق بنية للزمكان، حيث:
- السعر = إحداثي xxx،
- الزمن = ttt،
- لكن الزمن ليس مطلقًا — إنه نسبي للسوق.
- كل نقطة على الرسم البياني = حدث في الزمكان.
🔬 ما نوع المؤشر الفني الذي يمكننا بناؤه؟
🔧 مؤشر القوة النسبية النسبي (RRSI):
- مؤشر RSI عادي، ولكن محسوب بناءً على مقياس زمن غير خطي.
- يتم وزن الشموع وفقًا لـ”الزمن المسرع” τ(t).
- تمددات التقلب تؤدي إلى استجابة أسرع من RSI.
🤯 أو حتى:
🧭 مؤشر انحناء الزمن (TCI):
- يقيس مدى قوة واتجاه انحناء الزمن السوقي:
- 📈 انحناء إيجابي → تسارع في الحركة (مثل الجذب الثقالي)،
- 📉 انحناء سلبي → تباطؤ أو ركود.
⚙️ أفكار تنفيذية:
- إعادة حساب المؤشرات باستخدام الزمن السوقي المُوزن ω بدلاً من الأشرطة التقليدية.
- تصويره كشبكة مشوهة، مثل مخططات الزمكان في النسبية العامة.
- استخدام التعلم الآلي لنمذجة مقياس السوق عبر التقلب والحجم وكثافة التيك وردود الأفعال على الأخبار.
🚀 مكافأة: كيفية حساب التكامل الفعلي للتقلب
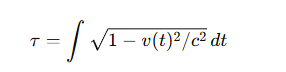
📘 في النسبية:
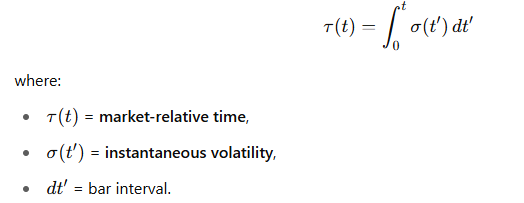
📈 في السوق:
🛠 كيفية حسابه عمليًا:
🔸 الخطوة 1: تقدير التقلب σ(t)
خيارات:
💠 التقلب المطلق:
sigma = abs(price[t] - price[t-1])
💠 الانحراف المعياري المتحرك:
sigma = price_series.rolling(window).std()
💠 ATR (المعدل الحقيقي المتوسط):
import ta
sigma = ta.volatility.AverageTrueRange(high, low, close, window=14).average_true_range()
🔸 الخطوة 2: دمج التقلب عبر الزمن
بالبيانات المنفصلة، يكون مجرد مجموع تراكمي:
rel_time = np.cumsum(sigma.values)
وبالتالي، rel_time[i] يوضح مدى تقدم السوق في زمنه الداخلي، وليس مجرد الوقت الزمني العادي.
📊 مثال بسيط بلغة Python:
import numpy as np
import pandas as pd

# لنفترض أن لدينا مصفوفة أسعار
price = np.array([...])

# حساب التقلب المطلق
sigma = np.abs(np.diff(price, prepend=price[0]))

# دمج التقلب
rel_time = np.cumsum(sigma)
>>>Learn more about professional software for Arbitrage Trading – SharpTrader