 Deutsch
 日本語
日本語 العربية
 한국어
한국어 Español
 Português
 Indonesia
 Tiếng Việt
 中文
中文
Pairs Trading Strategy Applied to Forex Friday June 7th, 2024 – Posted in: Arbitrage Software, Forex trading
A Comprehensive Guide with Formulas and Examples
Pairs trading can be effectively applied to the Forex market. This strategy involves taking long and short positions in two highly correlated currency pairs or indices to profit from their relative price movements. Here’s a detailed guide on implementing pairs trading in Forex, complete with formulas and examples.
What is Pairs Trading in Forex?
Pairs trading in Forex involves identifying two currency pairs that typically move together due to economic relationships or correlated market movements. The strategy profits from deviations in the correlation between these pairs, betting that the price relationship will revert to its mean over time.
Key Concepts
- Correlation: A statistical measure describing the degree to which two currency pairs move about each other, ranging from -1 to 1.
- Cointegration: A statistical property indicating that a linear combination of two or more time series variables has a stable mean over time.
- Mean Reversion: The concept that currency pair prices will revert to their historical average over time.
Steps to Implement Pairs Trading in Forex
- Identify a Pair: Select two currency pairs with a high historical correlation.
- Calculate the Spread: Determine the price difference (spread) between the two pairs.
- Monitor the Spread: Track the spread over time to identify deviations from the mean.
- Execute Trades: Open long and short positions when the spread deviates significantly from the mean.
- Close Trades: Close positions when the spread reverts to the mean.
Formulas and Calculations
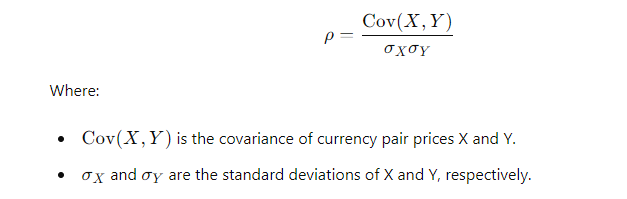
- Correlation Coefficient (ρ):
- Z-Score:
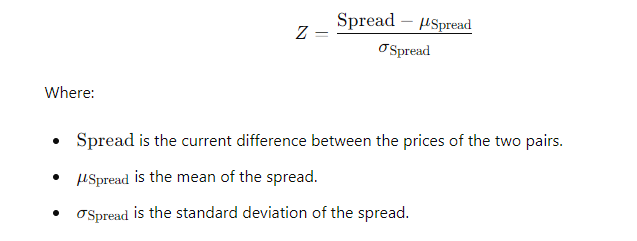
Calculating the Z-score is crucial when using spread for position opening in pair trading because it helps identify deviations from the historical mean and assess whether the spread is currently overvalued or undervalued relative to its typical behavior.
Here’s why we calculate the Z-score:
- Standardization: The Z-score standardizes the spread’s value by measuring how many standard deviations away from the mean. This standardization allows for a comparison of spreads across different pairs and periods, providing a normalized metric for analysis.
- Identification of Deviations: A high positive Z-score indicates that the spread is above its historical average, suggesting that one asset is overvalued relative to the other or that there may be an arbitrage opportunity. Conversely, a low negative Z-score indicates an undervalued spread, potentially signaling a buying opportunity.
- Entry and Exit Signals: Traders often use Z-scores for pairs trading positions as entry and exit signals. For example, if the Z-score exceeds a certain threshold (e.g., +2 or -2), it may trigger a trade entry or exit, indicating an anomaly in the spread’s behavior.
- Risk Management: Z-scores help traders assess the risk of a pair trading strategy by quantifying the likelihood of spread reversion to its mean. Higher Z-scores imply more significant deviations from the mean and may indicate higher risk and potentially higher returns if the spread converges.
- Strategy Optimization: By analyzing Z-scores over different time frames and adjusting parameters such as the entry threshold or stop-loss levels, traders can optimize their pair trading strategy to adapt to changing market conditions and enhance profitability.
In essence, calculating the Z-score provides traders with a statistical framework for evaluating spread dynamics, identifying trading opportunities, and managing risk effectively in pair trading strategies. Forex currency arbitrage strategies.
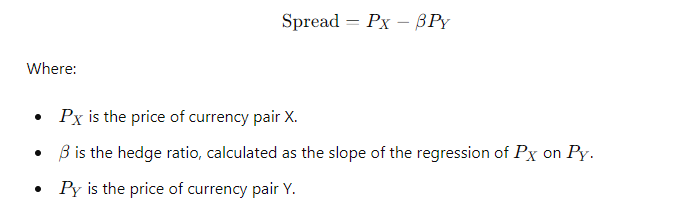
- Spread:
Example of Pairs Trading in Forex
Step 1: Identify a Pair. Suppose we choose EUR/USD and GBP/USD. These pairs often have a high correlation due to the relationship between the Euro and the British Pound. Euro arbitrage and EUR pair strategies.
Step 2: Calculate the Spread. Let’s say the prices are:
- EUR/USD: 1.1200
- GBP/USD: 1.3000
Assuming the hedge ratio (β) is 1.5, the spread is:
Spread=1.1200−1.5×1.3000=1.1200−1.9500=−0.8300
Step 3: Monitor the Spread We track the spread over time. Suppose it typically oscillates around -0.5000 with a standard deviation of 0.2000.
Step 4: Execute Trades If the spread widens to -1.0000, we could consider this a significant deviation. We would short EUR/USD and long GBP/USD:
- Short 1 lot of EUR/USD at 1.1200
- Long 1.5 lots of GBP/USD at 1.3000
Step 5: Close Trades We hold these positions until the spread reverts to the mean. If the spread narrows back to -0.5000, we close the trades:
- Buy back 1 lot of EUR/USD at 1.1000 (if the price drops)
- Sell 1.5 lots of GBP/USD at 1.3200 (if the price rises)
Profit Calculation:
- Profit from EUR/USD: 1.1200−1.1000=0.02001.1200–1.1000 = 0.02001.1200−1.1000=0.0200
- Profit from GBP/USD: 1.3200−1.3000=0.0200×1.5=0.03001.3200 – 1.3000 = 0.0200 \times 1.5 = 0.03001.3200−1.3000=0.0200×1.5=0.0300
- Total Profit: 0.0200+0.0300=0.05000.0200 + 0.0300 = 0.05000.0200+0.0300=0.0500 (pip value multiplied by the lot size)
To ensure that a one-pip price change has an equal impact on the trade value, we need to adjust the lot sizes for each instrument so that their value is proportional to the exchange rate.
Consider an example with three currency pairs: EUR/USD, GBP/USD, and USD/JPY.
For the EUR/USD pair, a standard lot is 100,000 euros. If you want a one-pip price change to equal $10, you need to determine the number of lots so that each pip costs $10.
For instance, if you select one standard lot (100,000 euros), a one-pip price change will be $10.
A standard lot for the GBP/USD pair is also 100,000 British pounds. If you also want a one-pip price change of $10, choose one standard lot (100,000 British pounds).
For the USD/JPY pair, a standard lot usually consists of 100,000 Japanese yen. If you want a one-pip price change to equal $10, you need to determine the number of lots so that each pip costs $10.
For example, if the USD/JPY exchange rate is 110, a one-pip change will be 1/110 * $100,000, approximately $909.09. To achieve a $10 change, you may need around nine micro-lots (or 0.09 standard lots).
Thus, for each instrument, you should calculate the number of lots so that a one-pip price change has an equal impact on the trade value in dollars or any other currency you prefer to measure your results in.
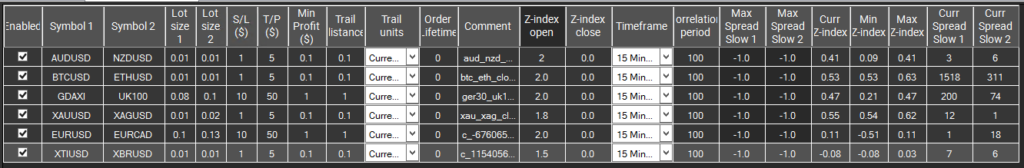
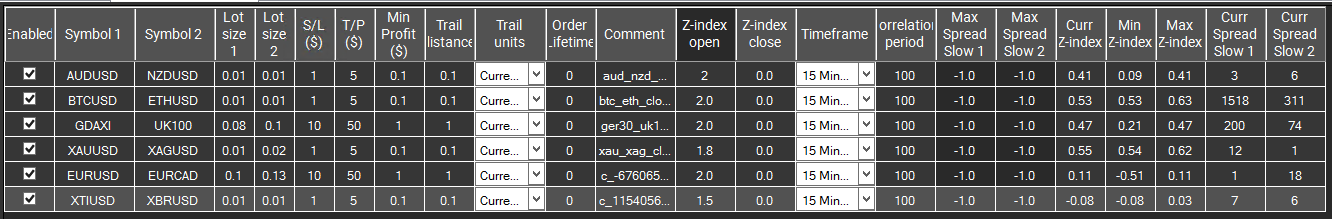
Fig 1. – SharpTrader PairsTrading Settings example
Video 1 – Pairs Trading Strategy in operation
Video 2– Pairs Trading Strategy how to setup.
Market Volatility: Impact on Pair Trading Strategy and Filter Applications
The pair trading strategy is often influenced by market volatility. Volatility determines how much prices fluctuate in the market over a certain period. Here’s how volatility can impact pairs trading:
- Increased Spread: High volatility can cause the spread between instruments to widen. This can make trading less attractive due to increased entry costs and reduced potential profits.
- Risk of Instability: High volatility can increase the risk of instability in pairs. Prices may change rapidly, making forecasting and risk control more challenging.
- Increased Opportunities: However, high volatility can also create more opportunities for pair trading. Large price movements can provide more chances to profit from price differences between different instruments.
- Strategy Adaptation: Traders involved in pair trading must adapt their strategies to changing market volatility. This may include adjusting position sizes, setting stop-loss orders, or changing trading timeframes.
- Correlation Impact: High volatility can also affect instrument correlation. In some cases, correlation may strengthen, while in others, it may weaken, impacting the results of pair trading.
- Risk Amplification: During high volatility, the risk of loss may increase, mainly if risks are not managed effectively. Traders should be prepared for stronger price movements and exercise caution when trading in such conditions.
What filters can be applied?
Various filters can be applied in pairs trading to manage risks and improve signal quality. Here are several types of filters that can be useful:
- Volatility Filters: These filters exclude trading signals during periods of high market volatility when prices may change too rapidly. For example, you can set a threshold value for volatility and ignore signals when volatility exceeds this value.
- Trend Filters: These filters help determine the current trend’s direction and use pair trading signals only in accordance with this trend. For example, you can use moving averages or trend indicators to determine the current price movement direction and trade only in that direction.
- Volume Filters: Filters based on trading volume can help confirm the strength of a trading signal. For example, you can look for pair trading signals only during high trading volume, which may indicate confirmation of the signal.
- Correlation Filters: These filters assess the degree of correlation between instruments. You can look for signals only if the correlation between instruments is within a specific range or level.
- Time Filters: Such filters can help exclude trading signals during specific time intervals when the market may be less predictable or liquid. For example, you can exclude signals during the Asian trading session if you prefer to trade only during more active trading hours.
These filters can be customized according to your preferences and trading strategy, helping you make more informed trading decisions and reduce risks.
Practical Considerations
- Transaction Costs: Ensure potential profits outweigh transaction costs, including spreads and commissions.
- Risk Management: Implement stop-loss orders to manage risk if the spread exceeds expectations.
- Market Conditions: Be aware of changing market conditions that might affect the correlation between the currency pairs.
Why Pair Trading Strategy Excels in Short-Term Periods Compared to Long-Term Investments
In the dynamic world of financial markets, strategies that capitalize on short-term fluctuations have gained significant popularity. Pairs trading is a versatile and practical approach well-suited for short-term trading. While pair trading can be adapted to longer timeframes, its inherent characteristics make it especially advantageous for short-term periods. Let’s explore why pair trading strategy shines in short-term trading compared to long-term investments.
- Exploiting Market Inefficiencies:
Pair trading thrives on identifying and exploiting short-term market inefficiencies. In short-term periods, these inefficiencies are more pronounced due to the rapid dissemination of news, economic data releases, and other market-moving events. Traders can capitalize on these short-lived anomalies to generate quick profits through pair trading strategies.
- Capitalizing on Correlation Dynamics:
Currency pairs and other assets exhibit varying degrees of correlation over different timeframes. In short-term trading, the correlation between pairs can fluctuate rapidly, offering ample opportunities for pair traders to profit from divergences and convergences. By closely monitoring correlation dynamics, traders can adjust their positions swiftly to maximize gains.
- Mitigating Systematic Risk:
Short-term pair trading allows traders to mitigate the systematic risk inherent in longer-term investments. By simultaneously holding long and short positions in highly correlated assets, pair trading aims to neutralize market exposure, thereby reducing vulnerability to broad market movements. This risk mitigation strategy is precious in volatile market conditions prevalent in short-term trading.
- Leveraging Technical Indicators:
Short-term pair trading often relies heavily on technical analysis and indicators, which are well-suited for capturing short-term price movements. Technical indicators such as moving averages, oscillators, and support/resistance levels provide valuable insights into short-term market trends and help traders make timely entry and exit decisions.
- Flexibility and Adaptability:
Short-term pair trading offers greater flexibility and adaptability compared to long-term investments. Traders can quickly adjust their strategies in response to changing market conditions, news events, and economic releases. This agility enables traders to capitalize on short-lived opportunities and minimize exposure to prolonged market downturns.
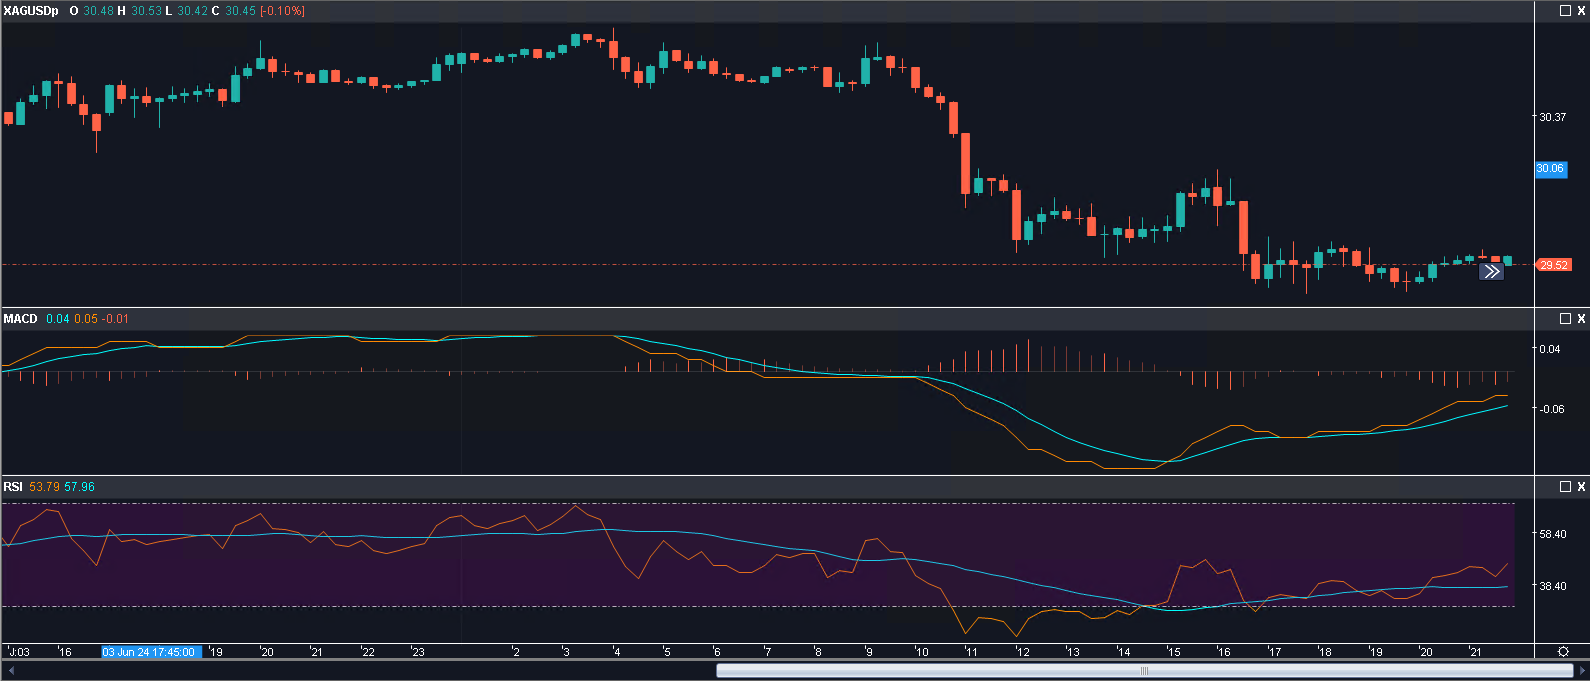
- Applying Technical Indicators:
In short-term pair trading, the strategic application of technical indicators plays a pivotal role in decision-making. Here’s how traders can effectively apply indicators:
- Moving Averages: Utilize short-term moving averages, such as the 5-period or 10-period moving average, to identify short-term trends and potential entry points. Crossovers between short-term and longer-term moving averages can signal momentum shifts.
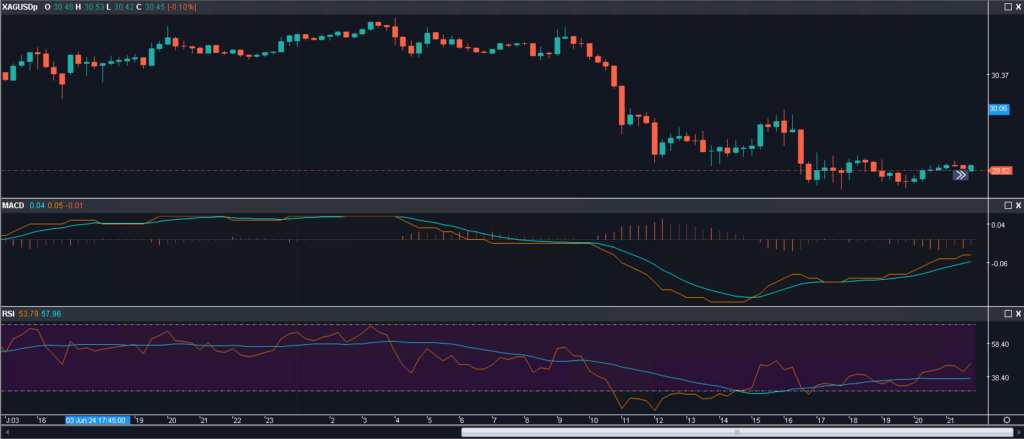
- Oscillators: The Relative Strength Index (RSI) and Stochastic Oscillator are valuable for identifying overbought and oversold conditions in short-term price movements. Traders can use these indicators to time their entries and exits based on market sentiment.
- Support and Resistance Levels: Identify critical support and resistance levels through technical analysis to anticipate potential reversal points or breakout opportunities. Short-term traders often look for price reactions near these levels to initiate or close positions.
- Volatility Indicators: Short-term pair trading can benefit from volatility indicators such as the Average True Range (ATR) or Bollinger Bands. These indicators provide insights into short-term price volatility, helping traders gauge potential price targets or stop-loss levels.
By incorporating these technical indicators into their pair trading strategy, traders can enhance their decision-making process and improve the timing of their trades. However, it’s essential to combine these indicators with other factors, such as market fundamentals, news events, and risk management principles, to make well-informed trading decisions.
Conclusion:
While pair trading can be applied across various timeframes, its effectiveness is particularly pronounced in short-term trading. By exploiting market inefficiencies, capitalizing on correlation dynamics, mitigating systematic risk, leveraging technical indicators, and maintaining flexibility, pair trading strategies excel in the fast-paced environment of short-term trading. Traders seeking to generate consistent profits in volatile markets may find pair trading a valuable addition to their arsenal of trading strategies. However, as with any trading approach, thorough research, risk management, and disciplined execution are essential for success. Pairs trading in Forex is a sophisticated strategy that can provide consistent profits in various market conditions. By understanding the statistical relationships between currency pairs and using rigorous analysis to identify trading opportunities, traders can capitalize on temporary deviations from historical norms. While the strategy requires careful monitoring and risk management, it offers a unique approach to achieving market neutrality and minimizing exposure to overall market movements.