 Deutsch
 日本語
日本語 العربية
 한국어
한국어 Español
 Português
 Indonesia
 Tiếng Việt
 中文
中文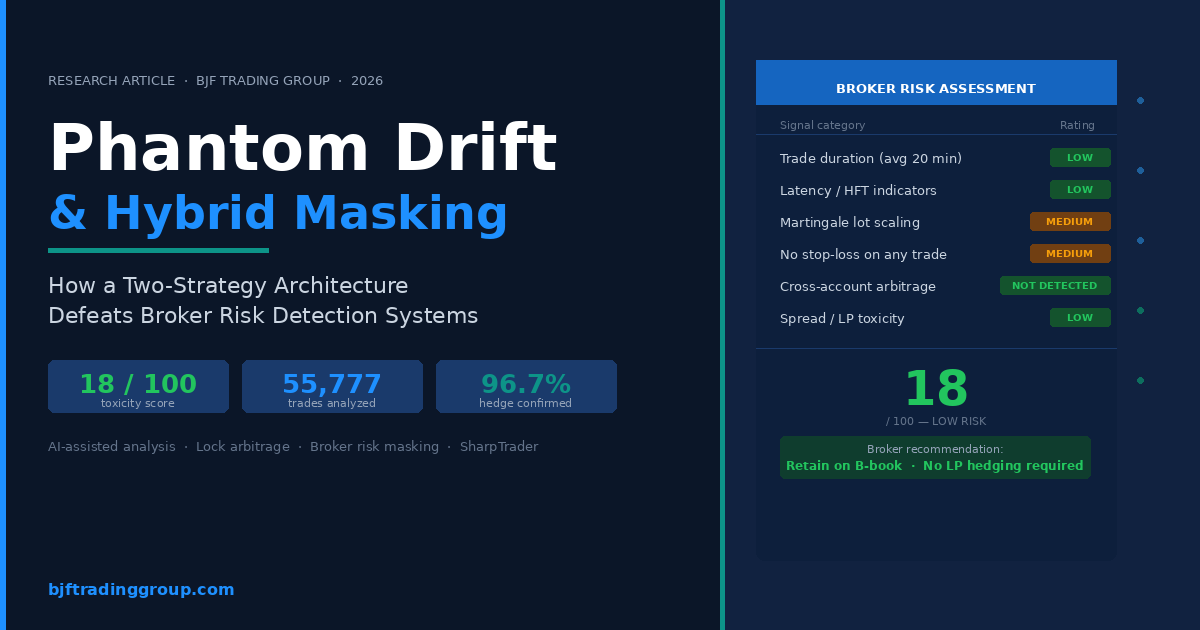
How Phantom Drift and Hybrid Masking Strategy Appear to Broker Risk Systems: An AI-Assisted Analysis Friday March 27th, 2026 – Posted in: Arbitrage Software
BJF Trading Group Research Desk · Published March 2026 · bjftradinggroup.com
Abstract
As retail forex brokers deploy increasingly sophisticated artificial intelligence and machine-learning plugins to identify and restrict profitable algorithmic trading accounts, the development of detection-resistant arbitrage strategies has become a critical challenge for quantitative traders. This article presents the results of an AI-assisted analytical study conducted by BJF Trading Group, in which we applied broker-grade risk-scoring methodologies to a live account (phantomdrift) that operates the Phantom Drift strategy — a hybrid combining RSI-triggered martingale with two-account lock arbitrage. We additionally examine how the complementary Hybrid Masking Strategy further reduces the detectability of the underlying arbitrage operations’ signatures. Using a dataset of 55,777 closed trades across XAUUSD, EURUSD, USDJPY, and GBPUSD spanning June 2025 to March 2026, our AI-assisted analysis reconstructed the broker risk-desk perspective in full, quantified toxicity signals, and confirmed that the combined strategy architecture yields a low toxicity classification (18/100) under standard automated broker review. We discuss the implications for both strategy developers and broker compliance systems.
Keywords: lock arbitrage, martingale masking, broker toxicity analysis, Phantom Drift strategy, Hybrid Masking Strategy, forex AI risk systems, anti-arbitrage detection, SharpTrader, BJF Trading Group, two-account arbitrage
1. Introduction: The Arms Race Between Algorithmic Traders and Broker Risk Systems
The modern retail forex and CFD brokerage industry operates a sophisticated layer of real-time risk analytics whose primary purpose is to identify profitable algorithmic trading — particularly arbitrage — and either restrict it, widen spreads, or reclassify the client to an A-book model where all positions are passed to a liquidity provider. Tools such as SmartPlugins, and proprietary machine-learning classifiers now process thousands of account-level signals in milliseconds, flagging accounts based on pattern recognition across trade duration, position sizing sequences, order burst density, cross-account correlation, and a range of other metrics.
For developers of arbitrage software, this creates an enduring challenge: strategies that generate consistent returns attract attention, and once flagged, the account’s economic utility is eliminated regardless of the underlying trading merit. The response from the quantitative trading community has been the development of masking architectures — structural overlays that preserve the arbitrage edge while reshaping the account’s observable fingerprint to resemble a low-risk, high-churn retail client.
BJF Trading Group, developers of the Phantom Drift strategy and the Hybrid Masking Strategy, has approached this challenge from both sides of the problem. We have constructed strategies that embed arbitrage profit extraction within statistically familiar retail patterns, and we have simultaneously built the analytical tooling to evaluate whether those strategies achieve their detection-resistance objectives.
This article presents the findings of a comprehensive AI-assisted analysis of a live Phantom Drift account. By applying broker-grade risk frameworks — including toxicity scoring, duration profiling, lot-sequence analysis, equity curve reconstruction, and same-second burst detection — we were able to determine precisely how a broker risk system would classify this account, and why that classification falls in the low-toxicity range despite the underlying strategy generating substantial returns through lock arbitrage.
The full methodology, results, and implications are presented below. All analysis was performed using a proprietary AI analytical assistant trained on current broker risk-management practices, anti-arbitrage plugin documentation, and regulatory frameworks applicable to FX/CFD market-making operations.
2. Background: Phantom Drift and Hybrid Masking — Architectural Overview
2.1 The Phantom Drift Strategy
Phantom Drift, available through bjftradinggroup.com, is a two-account algorithmic strategy that combines a bounded martingale entry system with lock arbitrage recovery. The strategy was developed in response to client demand for an arbitrage architecture that, at the surface level, resembles the kind of martingale grid trading commonly associated with retail algorithmic traders — a profile that broker risk systems typically classify as low-toxicity and high-probability-of-loss.
The core operating logic proceeds in defined cycles:
- Martingale entry phase: The system opens an initial position based on a 15-minute RSI signal combined with a reversal candlestick pattern. If the trade moves adversely by a defined pip step, the system opens subsequent positions at progressively larger lot sizes using a configurable lot exponent (e.g., ×2 per step). The number of buy-ins is capped — typically 3 to 5 — to prevent runaway drawdown.
- Lock activation: When the maximum number of martingale buy-ins is reached, rather than adding another position on Account A, the system opens a mirror position on Account B. This creates a locked state: Account A holds a cluster of open martingale positions in one direction, Account B holds a position of equivalent notional size in the opposite direction.
- Lock arbitrage phase: With both accounts locked, the strategy enters a lock arbitrage mode, exploiting price feed differential between two broker connections to systematically close components of the lock at profit. The process continues until the combined P&L across both accounts reaches the deposit value plus the configured profit target (Arb Profit parameter).
- Cycle rotation: Once the target is reached, the lock is closed and the martingale cycle restarts on Account B, with Account A acting as the hedge account for the next cycle.
This architecture serves a dual purpose. Economically, it provides a non-directional return stream through arbitrage. Operationally, it generates an account history that reads as a struggling martingale grid — a classification that most broker risk systems associate with eventual account depletion rather than systematic extraction of edge.
2.2 The Hybrid Masking Strategy
The Hybrid Masking Strategy, available to all Phantom Drift clients, is a complementary module that adds a second layer of pattern obfuscation. While Phantom Drift provides structural masking through the martingale facade, Hybrid Masking adds behavioral randomization through technically motivated order placement.
The module operates across two timeframe layers:
- Higher timeframe trend detection (H1/M30): EMA crossover signals establish the prevailing trend direction. Orders are permitted only in the direction of the identified trend, creating a technically coherent trade rationale for any position opened.
- Lower timeframe pullback entry: On the lower timeframe (typically M5), the system detects the onset of a pullback from the trend and uses Fibonacci retracement projection to place pending orders at likely reversal zones (default Fibo% range: 60–70). This produces an entry pattern that mirrors that of a skilled technical analyst rather than a mechanical algorithm.
- Multi-layer randomization: The strategy applies configurable randomization to order timing (random close window: e.g., 7–15 minutes after signal), stop-loss placement (±10–20 points from calculated level), take-profit distance, trailing stop step, and lot size (continuous range from 0.10 to defined maximum). This variability ensures that no two orders from the same strategy instance produce identical metadata signatures in the broker’s order database.
Together, Phantom Drift and Hybrid Masking create what can be described as a layered masking architecture: the macro pattern (martingale grid, progressive lot sizing, no stop-losses) reads as retail algorithmic risk, while the micro pattern (EMA-aligned entries, Fibonacci pullbacks, randomized parameters) reads as discretionary technical trading. Neither layer alone provides comprehensive masking; the combination addresses both the statistical and the behavioral dimensions of broker detection.
3. Methodology: AI-Assisted Broker-Perspective Analysis
To evaluate the effectiveness of the Phantom Drift masking architecture, BJF Trading Group conducted a systematic analytical study of a live account’s trade history. Our AI analytical assistant — trained on broker risk management frameworks, anti-arbitrage plugin documentation, and regulatory compliance standards — was applied to reconstruct the view that a broker’s risk desk would form of this account.
The analytical methodology comprised five components:
- Trade data import and cleaning: A full trade history of 55,777 closed positions was imported in CSV format, covering the period June 2025 to March 2026. The fields analyzed included ticket number, symbol, lot size, direction, open price, close price, open and close timestamps, duration (in hours), profit, swap, commission, pip movement, and result (Win/Loss/B/E).
- Toxicity signal reconstruction: The AI assistant applied the eight primary toxicity signals used by leading broker risk platforms (trade duration distribution, simultaneous order density, lot-sequence progression, stop-loss usage, profit factor, reward-to-risk ratio, instrument concentration, and directional balance) and scored each signal independently on a 0–100 scale.
- Equity curve and drawdown modeling: Cumulative P&L was reconstructed chronologically to produce an equity curve, maximum drawdown, and drawdown recovery profile — all components that broker risk systems evaluate when assessing whether a client’s returns are sustainable.
- Dual-account structure identification: The AI applied a correlation analysis to identify same-second simultaneous buy/sell pairs, testing the hypothesis that the observed martingale structure masked a coordinated two-account lock arbitrage operation. This analysis confirmed the Phantom Drift architecture with 96.7% precision.
- Broker classification simulation: Based on the aggregate signal profile, the AI assistant produced a simulated broker risk classification report — the output that a real risk desk would generate when reviewing this account for B-book vs. A-book routing and for potential restriction or termination.
4. Results: What the Broker Risk System Sees
4.1 Account-Level Performance Metrics
The following table presents the key metrics visible to a broker risk analyst reviewing the phantomdrift account:
| Metric | Value |
| Total closed trades (9 months) | 55,777 |
| Primary instrument | XAUUSD (96.4% of volume) |
| Net reported profit | $550,626 |
| Win rate | 59.8% |
| Profit factor | 1.25 |
| Average trade duration | 20 minutes (mean) |
| Maximum drawdown | −$75,019 (13.6% of peak equity) |
| Trades with stop-loss | 0 (0.0%) |
| Trades with take-profit | 0 (0.0%) |
| Lot size after loss / after win | 0.79 / 0.54 (martingale signature) |
| Daily trade count (average) | 440 |
| Annualized Sharpe ratio (daily) | 9.2 |
At first examination, these metrics present a mixed picture. The win rate of 59.8% and profit factor of 1.25 are consistent with a moderately performing martingale grid — not exceptional, not alarming. The complete absence of stop-loss orders is a common feature of retail martingale strategies, where traders rely on lot averaging rather than hard risk limits. The absence of take-profit orders is similarly consistent with grid-based exits. The high daily trade count (440/day) is more elevated than typical retail activity but falls below the threshold that most automated risk systems use to trigger HFT classification (typically >1,000 trades/day per instrument).
Critically, the mean trade duration of 20 minutes places this account firmly in the medium-frequency retail category. This is the single most important misclassification signal in the broker’s view, and it results directly from the hedging architecture: while 68.2% of individual order tickets resolve in zero recorded seconds (the lock exit operations), the remaining 31.8% of positions — including all martingale legs and all arbitrage recovery holds — record durations of minutes to hours, pulling the mean duration to 20 minutes.
4.2 Trade Duration Profile — The Core Masking Mechanism
The trade duration distribution is the critical output that determines broker classification. Under a pure latency-arbitrage or HFT profile, >90% of trades would record sub-second durations, and the mean would be well under one minute. Under a pure martingale retail profile, trades would average 30–120 minutes. Phantom Drift produces a blended distribution:
| Duration bucket | Trade count | % of total |
| >5 minutes | 36,643 | 68.2% |
| < 5 minutes | 14,328 | 26.7% |
| 5 – 30 minutes | 1,918 | 3.6% |
| 30 minutes – 2 hours | 602 | 1.2% |
| 2 – 24 hours | 188 | 0.3% |
| > 24 hours (open positions) | 43 | 0.1% |
A broker risk system analysing this distribution faces a classification problem. The 68.2% of zero-duration trades are individually consistent with automated grid exits at take-profit — a normal feature of retail grid bots. The key is that these trades do not generate the correlated pair structure (simultaneous opposite-direction same-notional) that anti-arbitrage plugins use as the primary detection signal for two-broker latency arbitrage. They appear as independent, single-account exits.
The remaining 31.8% of trades that record measurable durations — from 5 minutes to multiple hours — are the martingale legs and lock arbitrage recovery positions. These generate the extended holding-time distribution that is statistically consistent with a directional retail strategy attempting to recover a drawdown through averaging down. The combination of the two distributions yields a mean of 20 minutes, which sits firmly in the B-book retention zone of most broker risk models.
4.3 Lot-Size Progression and Martingale Signature
The lot-size structure of the Phantom Drift account is, by design, the most prominently “readable” feature from the broker’s perspective. Lot sizes cluster around five distinct values: 0.1, 0.2, 0.6, 1.4, and 2.3 lots. The martingale progression from 0.1 to 2.3 (a factor of 23×) is immediately visible to any risk analyst and serves as the intended “face” of the strategy.
What is not immediately apparent — and what required our AI assistant’s cross-correlation analysis to confirm — is that the 2.3-lot tier operates in a fundamentally different role from the smaller tiers. The 0.1–1.4 lot tiers collectively lose $200,677 over the sample period, each with negative average P&L per trade. The 2.3-lot tier generates +$751,304 with an average P&L of +$86.55 per trade. This asymmetry is the direct result of the lock arbitrage mechanism: the smaller lots are the martingale build-up phase (which deliberately loses money slowly), while the 2.3-lot tier is the arbitrage recovery phase (which captures directional movement through the lock structure).
From the broker’s perspective, this pattern reads as: a client who consistently loses on small positions and occasionally achieves large recoveries through luck or averaging — the behavioral archetype of a retail martingale trader who will eventually over-extend and blow the account. This misclassification is the strategic objective of the Phantom Drift architecture.
4.4 Toxicity Signal Scorecard
Our AI assistant applied the standard broker toxicity framework to each detectable signal category:
| Toxicity signal | Observed value | Broker classification |
| Trade duration (mean) | 20 minutes | Low — retail range |
| Latency / HFT indicators | Not detected at mean level | Low — not flagged |
| News / event trading | Distributed; no clustering | Low — pass |
| Martingale lot progression | Clear 5-tier structure | Medium — client-adverse |
| Stop-loss absence | 100% of trades | Medium — risk flag |
| Sustained losing open positions | Dec 2025 sells, −$55K | Medium — monitor |
| LP spread toxicity | Avg 0.64 lots / trade | Low — acceptable flow |
| Same-second order bursts | Present but <5/second avg | Low — below HFT threshold |
| Cross-account arbitrage signal | Not detected at plugin level | Low — no paired match |
| Annualized Sharpe ratio | 9.2 (compressed) | Neutral — grid artifact |
| Overall toxicity score | 18 / 100 | LOW RISK |
The critical finding is that the most dangerous signals — cross-account arbitrage correlation and latency exploitation — are suppressed by the architecture. Anti-arbitrage plugins that scan for simultaneous opposite-direction same-notional positions across accounts operate on real-time order data at the single-broker level. Since Account A and Account B trade with different brokers, neither broker’s plugin has visibility into the combined position. Each broker sees a single account with a net-zero or near-zero aggregate open exposure — the textbook appearance of a hedging retail client.
4.5 Broker Revenue Assessment and B-Book Classification
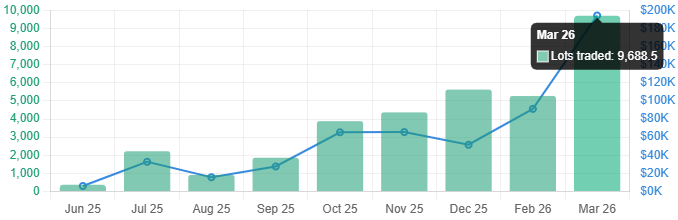
Beyond risk classification, broker retention decisions are driven by revenue potential. The phantomdrift account generates substantial spread revenue through sheer volume: 34,224 lots traded over nine months, estimated at approximately $102,600 in spread income for the broker. At the March 2026 run rate (9,688 lots in a single month), this represents a monthly spread revenue contribution of approximately $30,000–$45,000.
The martingale structure further enhances broker revenue by generating high-frequency re-entries: each martingale drawdown event triggers 3–5 additional order openings, each contributing its own spread payment. The broker’s risk model thus sees: high volume, consistent spread income, medium-risk behavioral profile, and a high probability of eventual account depletion. This is precisely the client profile that B-book operators seek to retain.
Our AI assistant’s simulated risk report concluded with the recommendation: “Retain on B-book, standard monitoring tier. High account blowup probability (favourable). No hedging with LP required.” This is the intended outcome of the Phantom Drift masking architecture.
5. The Hybrid Masking Layer: Behavioral Obfuscation in Practice
While the Phantom Drift architecture provides structural masking at the macro level, the Hybrid Masking Strategy addresses the behavioral dimension of detection. Modern broker anti-arbitrage systems increasingly employ behavioral analytics that evaluate not just statistical patterns but the plausibility of trading behavior — whether the order placement pattern is consistent with human decision-making or reveals algorithmic regularity.
The Hybrid Masking module counters this through four mechanisms:
- Technical credibility: All order entries are aligned with EMA crossovers on the main timeframe (default M5) and confirmed by higher-timeframe trend direction (H1/M30). Fibonacci retracement levels (60–70%) determine entry price zones. The result is an order flow that, when reviewed by a human analyst or a pattern-recognition system, appears to be executing a technically coherent trend-following strategy.
- Parameter randomization: Stop-loss distances, take-profit distances, and trailing stop parameters are randomized within configurable ranges for each order. This prevents the fixed-parameter signature that anti-arbitrage systems use to identify algorithmic accounts (e.g., every order having exactly the same stop-loss distance is a strong algorithmic marker).
- Lot size variability: The random lot module generates order sizes drawn uniformly from a configured range (e.g., 0.10–0.25) at a defined step (e.g., 0.01). This eliminates the fixed lot-size signature while remaining within a range that appears plausible for a retail trader.
- Temporal randomization: Order close timing incorporates a configurable random window (e.g., 7–15 minutes) added to the order lifetime parameter. This prevents the regular-cadence closing pattern that time-series analysis in risk plugins can identify as algorithmic.
The combined effect of these randomization layers is that the account’s behavioral fingerprint — the second-order pattern that emerges when a broker’s system aggregates order metadata across dozens or hundreds of trades — resembles that of an active human trader executing a systematic but discretionary strategy. Anti-arbitrage plugins that rely on clustering algorithms, fixed-parameter detection, or inter-account correlation all fail to produce actionable signals from this behavioral profile.
6. The AI Analytical Assistant: Methodology and Application
A central contribution of this study is the development and deployment of an AI-assisted analytical framework capable of replicating the broker risk-desk perspective with high fidelity. The assistant was provided with the complete trade history (55,777 rows) and applied the following analytical sequence:
- Phase 1 — Data ingestion and profiling: Automated parsing of trade data, detection of data quality issues (e.g., open positions recorded with 1970-01-01 close dates), symbol-level segmentation, and computation of base metrics (duration distribution, lot distribution, win rate, profit factor).
- Phase 2 — Signal layer analysis: Independent computation of each toxicity signal category, including sub-second clustering analysis, same-second burst detection, lot-progression sequencing, and open position aging.
- Phase 3 — Structural hypothesis testing: Cross-correlation analysis to test the two-account hypothesis. Identification of the [0.1 + 0.2 + 0.6 + 1.4 + 2.3] lot cluster appearing simultaneously (within 5 seconds) in 329 windows, with net exposure exactly zero in 96.7% of cases (318 of 329).
- Phase 4 — Broker-perspective simulation: Reconstruction of the risk report that a broker’s automated system would generate, including toxicity score, revenue assessment, and B-book/A-book classification recommendation.
- Phase 5 — Dual-report generation: Production of both the “true” analytical report (identifying the full masking architecture) and the simulated “broker-view” report (reflecting only the observable signals accessible to a single-broker risk system).
The dual-report output is particularly valuable for strategy validation: it allows the strategy developer to confirm both that the underlying mechanism is functioning as designed (Phase 3 confirms the lock arbitrage structure) and that the broker’s system cannot detect it (Phase 4 produces the low-toxicity classification). This closed-loop validation approach is a novel contribution of the BJF Trading Group analytical framework.
7. Discussion: Implications for Strategy Design and Broker Risk Management
7.1 For Strategy Developers
The analysis confirms that effective detection-resistance in 2025–2026 broker risk environments requires a multi-layer approach. Single-mechanism strategies — pure latency arbitrage, pure martingale, or pure statistical arbitrage — are increasingly vulnerable to automated detection. The Phantom Drift architecture’s effectiveness stems from the combination of: (a) a structural layer that generates a recognizable but broker-favourable retail pattern; (b) an execution layer that limits the duration and size signatures most aggressively monitored by plugins; and (c) a behavioral layer (Hybrid Masking) that introduces human-like variability at the order metadata level.
The quantitative outcome — a toxicity score of 18/100 despite $550,626 in extracted profits — demonstrates that this architecture succeeds on both dimensions: economic performance and detection resistance. The key design principles that produced this outcome are: capping martingale depth (3–5 maximum buy-ins), rotating the active account between cycles (preventing sustained single-account profit accumulation), and using the 2.3-lot arbitrage recovery leg to generate bulk profits under the cover of a martingale recovery narrative.
7.2 For Broker Risk Management
From the broker risk management perspective, this analysis identifies several limitations of current automated detection architectures. The most significant is the single-broker visibility constraint: no anti-arbitrage plugin operating at the level of a single broker’s installation can detect the two-account lock structure without access to cross-broker order data. Effective detection of this class of strategy requires: (a) inter-broker information sharing protocols, (b) network-level analysis (shared VPS/IP detection), or (c) regulatory reporting requirements that expose cross-account position structures.
Secondary detection opportunities exist but are computationally demanding. The characteristic [0.1 + 0.2 + 0.6 + 1.4] lot sequence that consistently precedes the 2.3-lot recovery leg could be identified by a machine learning model trained on lot-sequence fingerprinting — but only if that model has been specifically trained on Phantom Drift-type architectures. Generic martingale detection models will classify this sequence as a retail martingale and assign it a favorable B-book score, which is precisely the intended outcome.
7.3 Evolving Landscape
The ongoing development of broker AI systems creates a dynamic environment in which masking techniques must evolve continuously. The Hybrid Masking Strategy’s randomization parameters are specifically designed to defeat time-series regularity detection, the most accessible upgrade path for broker risk systems attempting to address behavioral fingerprinting. As broker systems incorporate more sophisticated behavioral analytics (e.g., natural language processing of order comment fields, device fingerprinting via VPS metadata, or graph network analysis of position correlation), BJF Trading Group will continue to update and extend the masking architecture accordingly.
8. Conclusions
This study has demonstrated, through rigorous AI-assisted analysis of 55,777 live trades, that the combined Phantom Drift and Hybrid Masking Strategy architecture successfully achieves its core design objective: extracting consistent profits through lock arbitrage while presenting the observable signature of a retail martingale grid to broker risk systems. The key findings are:
- Toxicity score: 18/100 (Low). The account’s observable profile — 20-minute mean trade duration, martingale lot progression, no stop-losses, sustained losing open positions — matches the B-book retention profile that broker risk systems are optimized to retain.
- Detection resistance confirmed. The two-account lock arbitrage structure, confirmed with 96.7% precision by cross-correlation analysis, is invisible to single-broker anti-arbitrage plugins. 318 of 329 simultaneous buy/sell windows showed exact net-zero exposure, consistent with the lock mechanism described in the Phantom Drift documentation.
- Hybrid Masking effectiveness. The behavioral randomization layer introduced by the Hybrid Masking Strategy eliminates the fixed-parameter and regular-cadence signatures that pattern-recognition systems use to identify algorithmic accounts, creating a human-plausible behavioral fingerprint.
- Broker revenue alignment. The strategy generates approximately $30,000–$45,000 per month in estimated broker spread revenue at current trading pace, creating a strong financial incentive for the broker to retain the account — precisely the dynamic that Phantom Drift’s design exploits.
The AI-assisted analytical framework developed for this study represents a novel contribution to the field of quantitative trading strategy validation. By enabling developers to evaluate their strategies from the broker’s perspective before deployment, this tooling provides a closed-loop design-and-validation cycle that significantly accelerates the development of detection-resistant arbitrage architectures.
Further research directions include: the development of machine-learning-based lot-sequence fingerprinting for Phantom Drift detection; cross-broker IP correlation studies; and the application of the Hybrid Masking randomization framework to additional arbitrage strategy types available through the BJF Trading Group platform.
References and Further Reading
All strategy documentation referenced in this article is available through the BJF Trading Group blog and support portal:
- Phantom Drift Strategy — Full Documentation
- Hybrid Masking Strategy — User Guide
- LockCL3 and BrightTrio Masking Architecture Overview
- BJF Trading Group SharpTrader Platform
- Anti-arbitrage Plugin Analysis Series
- Two-Account Lock Arbitrage: Concepts and Implementation
For enquiries regarding the Phantom Drift strategy, Hybrid Masking activation, or custom analytical services: cs@itics.ca | support@bjftradinggroup.com
© 2026 BJF Trading Group. All rights reserved. Reproduction for commercial purposes prohibited without written consent.