 English
 Deutsch
 日本語
日本語 한국어
한국어 Español
 Português
 Indonesia
 Tiếng Việt
 中文
中文
Optimizing Pairs Trading Using the Z-Index Technique 30/04/2024 – Posted in: Arbitrage Software, Forex trading – Tags: pair trading, pairs trading, statistical arbitrage, z-score
Introduction
Pairs trading is a financial strategy that seeks to capitalize on predictable price patterns or inefficiencies identified through statistical analysis. The core idea is to profit from the mean reversion of the relative prices of two historically correlated securities. In simpler terms, pair trading software involves betting that the price relationship between these securities, which has deviated from the historical norm, will eventually revert to its average state.
This strategy often uses complex mathematical models to identify these price anomalies among hundreds or thousands of securities, executing high-frequency trades to exploit slight price discrepancies that may exist only for a short duration.
Exploring Market Strategies: The Distinctions Between Statistical Arbitrage and Pairs Trading
Statistical arbitrage and pairs trading are strategies that attempt to exploit price inefficiencies in the market. Still, they differ in their scope, methodology, and the nature of their target opportunities. Here’s a breakdown of each:
Statistical Arbitrage
Concept: Statistical arbitrage (stat arb) involves a portfolio of a hundred or more stocks that are carefully chosen based on quantitative models. The strategy is typically implemented using complex mathematical algorithms and high-speed computer programs to detect and act on price discrepancies across hundreds or thousands of securities.
Methodology: It utilizes advanced statistical and econometric techniques such as mean reversion, cointegration, and principal component analysis. The approach is often highly automated and relies on short-term reversion to the mean within the trading portfolio.
Scope: Statistical arbitrage can cover a broad range of assets and is not limited to stocks; it can include futures, options, and other derivatives. The strategy usually involves complex calculations and models to predict price movements.
Objective: The goal is to achieve a risk-neutral strategy that provides a positive return regardless of market conditions, often involving numerous trades and very narrow profit margins per trade, accumulated over time for significant returns. Learn more about Statistical Arbitrage
Pairs Trading
Concept: Pairs trading is a type of statistical arbitrage but with a simpler approach. It involves only two closely related stocks, usually within the same industry. The strategy hinges on the historical relationship between the two stocks; when this relationship deviates, trades are made with the expectation that it will revert to the mean.
Methodology: This strategy typically uses simple statistical methods like correlation and cointegration to identify pairs of stocks whose prices move together. When the spread between the stocks widens beyond a standard deviation, it signals a trade opportunity.
Scope: Pair trading is more focused and less diversified than statistical arbitrage. It usually involves just two stocks, making it easier to manage and less computationally intensive.
Objective: The aim is to profit from the convergence in the price of the two stocks. It assumes that the prices of the two stocks will eventually revert to their historical mean, thereby earning a profit from the long position in the undervalued stock and the short position in the overvalued stock.
Key Differences
- Complexity: Statistical arbitrage is more complex and involves sophisticated statistical models to analyze differences in price movements across a broad array of securities. Pairs trading focuses only on two stocks and typically uses more uncomplicated statistical measures.
- Risk and Return: Statistical arbitrage aims to be market-neutral and hence often carries lower risk but requires more capital due to the large number of assets involved. Pairs trading involves higher risks if the relationship between the two stocks breaks down but requires less capital.
- Speed and Frequency of Trades: Statistical arbitrage often involves high-frequency trading due to the short-lived nature of the arbitrage opportunities it seeks. Pairs trading may involve fewer transactions over extended periods, depending on the frequency of divergence from the mean.
In essence, while both strategies aim to exploit inefficiencies in the prices of securities, statistical arbitrage is broader and more complex, involving many assets and high-speed trading. In contrast, pairs trading focuses on the relationship between just two stocks.
Typically, pairs trading involves the following key concepts:
Pairs Trading
This is the most common form of pairs trading, where two highly correlated stocks are paired together. When their price paths diverge, the underperforming stock is bought (long position) while the outperforming stock is sold (short position), assuming their price paths will converge in the future.
Mean Reversion
This principle posits that high and low prices are temporary and a price will tend to move to an average price over time. Pairs trading urs look for temporarily mispriced securities relative to their historical pricing patterns and bet on their return to the mean.
Cointegration
Rather than relying solely on correlation, pairs trading also employs cointegration, a statistical property of time series variables whereby if two or more series are non-stationary, their linear combination can be stationary. This helps to ensure that the securities will move in sync over the long term despite short-term deviations.
Sophisticated Algorithms
These are used to quickly analyze historical data to forecast price movements and execute trades automatically. The speed and volume of data processed require substantial computational resources and sophisticated algorithms, making pairs trading a capital and technology-intensive strategy.
Due to the complex calculations and the speed required in execution, pairs trading is typically employed by hedge funds and institutional traders. It is considered a relatively low-risk strategy as it often involves hedged positions, aiming for consistent, small gains rather than spectacular profits. However, its success relies on robust models, accurate data, and efficient execution.
The Core Challenges of Pairs trading: Identifying Correlations and Capitalizing on Divergence
Two key challenges must be addressed to build a successful pairs trading strategy. The first task involves identifying instruments that exhibit either a historical or inverse historical correlation. This foundational step ensures that the selected securities have demonstrated a tendency to move in concert or in opposite directions over time, providing a predictable framework upon which to base trading decisions.
The second task is to pinpoint the precise moment when these correlated or inversely correlated instruments begin to diverge. This signal, indicative of a temporary misalignment in their typical price relationship, is critical for executing trades that capitalize on the eventual reversion to their mean historical behavior. By adeptly managing these two challenges, traders can effectively harness the potential of pairs trading, strategically exploiting temporary inefficiencies in the market for profitable outcomes.
Exploring the Dynamics of Historical and Inverse Correlations in Financial Markets
Historical and inverse historical correlation are key financial concepts that are especially relevant in pairs trading and pair trading strategies. Understanding these concepts is crucial for identifying relationships between securities and predicting their future movements based on past behavior.
Historical Correlation
Historical correlation refers to the statistical relationship between two or more securities or datasets that tend to move in the same direction. It is quantified using the correlation coefficient ranging from -1 to +1. A correlation coefficient close to +1 indicates that the securities have a strong positive correlation; that is, they typically move in the same direction under similar circumstances. This might be due to identical market influences affecting them or shared characteristics such as belonging to the same industry or being sensitive to the same economic factors.
For example, two tech stocks, Apple and Microsoft, may exhibit a high correlation since similar economic conditions, technological advancements, and market sentiments influence them.
Tab. 1 – Stocks correlation matrix
| American Airlines | Alcoa corp | Apple Inc | Best Buy Co | Citi Group | Sentinel One | CVS | Chevron | Home Depo | IBM | |
| American Airlines | -0.42 | 0.14 | 0.23 | 0.05 | 0.5 | 0.46 | 0.03 | 0.54 | 0.42 | |
| Alcoa corp | -0.42 | -0.63 | 0.61 | 0.76 | -0.8 | -0.33 | 0.67 | -0.21 | 0.27 | |
| Apple Inc | 0.14 | -0.63 | -0.75 | -0.82 | 0.6 | -0.03 | -0.72 | -0.36 | -0.61 | |
| Best Buy Co | 0.23 | 0.61 | -0.75 | 0.9 | -0.5 | 0.17 | 0.77 | 0.51 | 0.65 | |
| Citi Group | 0.05 | 0.76 | -0.82 | 0.9 | -0.63 | 0.15 | 0.84 | 0.37 | 0.66 | |
| Sentinel One | 0.5 | -0.8 | 0.6 | -0.5 | -0.63 | 0.17 | -0.5 | 0.06 | -0.05 | |
| CVS | 0.46 | -0.33 | -0.03 | 0.17 | 0.15 | 0.17 | 0.01 | 0.71 | 0.19 | |
| Chevron | 0.03 | 0.67 | -0.72 | 0.77 | 0.84 | -0.5 | 0.01 | 0.16 | 0.59 | |
| Home Depo | 0.54 | -0.21 | -0.36 | 0.51 | 0.37 | 0.06 | 0.71 | 0.16 | 0.56 | |
| IBM | 0.42 | 0.27 | -0.61 | 0.65 | 0.66 | -0.05 | 0.19 | 0.59 | 0.56 |
Tab. 2 – Cryptocurrencies correlation matrix
| BTC | ETH | ADA | LTC | XRP | |
| BTC | 0.79 | 0.52 | 0.81 | 0.51 | |
| ETH | 0.79 | 0.58 | 0.81 | 0.56 | |
| ADA | 0.52 | 0.58 | 0.57 | 0.46 | |
| LTC | 0.81 | 0.81 | 0.57 | 0.58 | |
| XRP | 0.51 | 0.56 | 0.58 | 0.58 |
Tab. 3– Matrix: cryptocurrencies correlation with commodities
| BTC | ETH | LTC | ADA | XRP | |
| OIL | 0.11 | 0.07 | 0.1 | 0.06 | 0.08 |
| GOLD | 0.15 | 0.14 | 0.15 | 0.09 | 0.06 |
| SILVER | 0.26 | 0.23 | 0.24 | 0.16 | 0.16 |
| GAS | -0.03 | 0.01 | -0.02 | -0.02 | -0.04 |
Tab. 4 – Correlation matrix between indices
| IBX50 | CAC40 | DAX | FTSE100 | FTSE | NIKKE1225 | SP500 | SPTSX | Sensex | SSEE | |
| IBX50 (Brazil) | 0.73 | 0.69 | 0.72 | 0.69 | 0.33 | 0.82 | 0.85 | 0.53 | 0.34 | |
| CAC40 (France) | 0.73 | 0.97 | 0.95 | 0.91 | 0.51 | 0.74 | 0.81 | 0.63 | 0.39 | |
| DAX (Germany) | 0.69 | 0.97 | 0.94 | 0.91 | 0.53 | 0.73 | 0.8 | 0.57 | 0.37 | |
| FTSE100 (UK) | 0.72 | 0.95 | 0.94 | 0.89 | 0.48 | 0.75 | 0.84 | 0.62 | 0.39 | |
| FTSE (Italy) | 0.69 | 0.91 | 0.91 | 0.89 | 0.42 | 0.72 | 0.79 | 0.56 | 0.29 | |
| NIKKE1225 (Japan) | 0.33 | 0.51 | 0.53 | 0.48 | 0.42 | 0.33 | 0.4 | 0.35 | 0.49 | |
| SP500 (USA) | 0.82 | 0.74 | 0.73 | 0.75 | 0.72 | 0.33 | 0.89 | 0.45 | 0.3 | |
| SPTSX (Canada) | 0.85 | 0.81 | 0.8 | 0.84 | 0.79 | 0.4 | 0.89 | 0.56 | 0.38 | |
| Sensex (India) | 0.53 | 0.63 | 0.57 | 0.62 | 0.56 | 0.35 | 0.45 | 0.56 | 0.53 | |
| SEE (China) | 0.34 | 0.39 | 0.37 | 0.39 | 0.29 | 0.49 | 0.3 | 0.38 | 0.53 |
Inverse Historical Correlation
Inverse historical correlation, or negative correlation, describes a relationship where two securities move in opposite directions. Here, the correlation coefficient approaches -1, indicating that as one security’s price increases, the other’s decreases, and vice versa. This might occur between competitively positioned securities or asset classes that react differently to economic changes.
A classic example is the relationship between stocks and bonds. Typically, when the stock market performs poorly, bonds do well, and when the stock market soars, bond prices might drop because investors seek higher returns from stocks.
Differences Between Historical Correlation and Inverse Historical Correlation
The primary difference between these two types of correlations is the direction in which the paired securities move relative to each other:
Direction of Movement:
Positive Correlation: Securities move in the same direction. A high positive correlation suggests that the securities will likely gain or lose value together.
Negative Correlation: Securities move in opposite directions. When one security performs well, the other tends to perform poorly.
Strategic Implications:
Positive Correlation: Used strategies to diversify within similar asset classes or sectors, expecting similar factors to drive both assets.
Negative Correlation: This strategy is employed in risk management strategies to hedge against market volatility by balancing the portfolio with assets that react differently to the same events.
Usage in Trading Strategies
Positive Correlation: Traders might look for moments when the prices of the correlated assets diverge, anticipating that they will realign, hence executing convergence trades.
Negative Correlation: Traders can exploit this by setting up pairs trades where they go long on one asset and short on the other, profiting from the widening gap between them.
Understanding these correlations allows traders and investors to decide which securities to pair for trading, how to hedge risks, and the best ways to exploit market inefficiencies for arbitrage opportunities.
Determining instruments with historical or inverse historical correlation involves a systematic approach that leverages statistical analysis to uncover relationships between securities over time. Here’s a detailed overview of how to identify such correlations:
- Data Collection
Start by collecting historical price data for the instruments you are considering. This data should include daily closing prices, though for more precise analysis, you might also consist of opening, high, and low prices. The time series length should be sufficient to capture different market conditions—typically, a few years of data.
- Data Preparation
Prepare the data by ensuring it is clean and normalized. This involves handling missing values, adjusting for splits and dividends in stock prices, and converting prices to returns. Most correlation analyses in finance are conducted using returns rather than absolute price values because returns are more stationary and generally provide a more stable basis for comparison.
- Calculate Returns
Calculate the returns of the instruments. Returns can be calculated using the formula:

- Correlation Analysis
Perform correlation analysis on the returns of the pairs of instruments. You can calculate the Pearson correlation coefficient, which measures the linear relationship between two datasets. The correlation coefficient, ρ, ranges from -1 to 1, where:
1 indicates a perfect positive correlation,
-1 indicates a perfect negative (inverse) correlation,
0 indicates no linear correlation.
- Interpret the Results
Analyze the correlation coefficients:
High positive values (close to 1) suggest a strong positive historical correlation.
High negative values (close to -1) indicate a strong inverse historical correlation.
Values close to 0 suggest little to no linear correlation.
- Statistical Significance
Test the statistical significance of the correlation coefficients to ensure that the observed relationships are not due to random chance. This can typically be done using hypothesis testing with a null hypothesis that the correlation is zero.
- Visualization
Visual tools such as scatter plots can be used to assess the relationship between the two instruments visually. Additionally, plotting the price or return series over time can help visualize how closely the movements of the two instruments are related.
- Continuous Monitoring
Correlations can change over time due to shifts in economic conditions, market environments, or company-specific events. It’s crucial to continuously monitor and update the correlations to ensure the relationships hold over the period during which you intend to trade.
- Integration into Trading Strategy
Once you have established which instruments are correlated or inversely correlated, you can integrate this information into your trading strategy, considering whether to implement strategies like pairs trading, portfolio diversification, or risk management.
This methodology provides a robust framework for identifying and utilizing historical and inverse correlations in financial markets, aiding in developing sophisticated trading and investment strategies.
Employing the Z-Score in Pairs trading Strategies
Pairs trading is a complex quantitative trading strategy that attempts to capitalize on price inefficiencies between related financial instruments. One of the methods employed in pairs trading is based on the Z-score, which measures the deviation of a data point from the mean, expressed in units of standard deviation. Here’s a detailed explanation of how pairs trading can be applied using the Z-index:
Basics of Z-Score
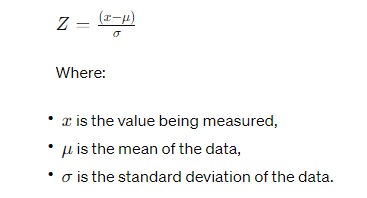
The Z-score is a statistical measurement that describes a value’s relationship to the mean of a group of values. It is measured in terms of standard deviations from the mean. The formula to calculate the Z-score of an observation x is:
Application in Pairs trading
In pairs trading, the Z-score is handy for identifying when a trading asset’s price is statistically far from its historical mean, under the assumption that the price will revert back towards the mean. This strategy is often applied to pairs trading.
Steps in Pairs trading Using the Z-index:
- Pair Selection: Identify pairs of stocks (or other assets) that historically move together. This can be done by analyzing the correlation or cointegration between the two stocks.
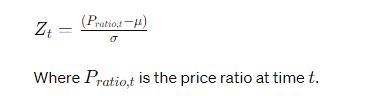
- Price Ratio and Mean Calculation: Calculate the ratio of the prices of the two stocks for a given historical period. Then, compute this ratio’s mean (μ) and standard deviation (σ).
- Z-score Calculation: Continuously calculate the Z-score of the current price ratio using the historical mean and standard deviation. This indicates how far the current ratio deviates from its historical norm.
- Trade Execution:
- Buy the underperformer / Sell the overperformer: If the Z-score is significantly negative (e.g., less than -2), it suggests that the price ratio is meager, and the trader might buy the underperforming stock and sell the overperforming stock, expecting the ratio to revert to the mean.
- Sell the underperformer / Buy the overperformer: Conversely, if the Z-score is significantly positive (e.g., greater than +2), it suggests that the price ratio is unusually high, and the trader might sell the underperforming stock and buy the overperforming stock.
- Exit Strategy: The trades are typically closed when the Z-score returns to zero, indicating that the price ratio has reverted to its historical average.
Why Use the Z-index in Pairs trading?
Using the Z-index in pairs trading helps to standardize the measurement of price deviations, allowing for a systematic approach to trade on mean-reversion in pairs of stocks. It quantifies the extent to which the current scenario is unusual and provides a trigger for entering and exiting trades based on statistical norms.
This method, while powerful, requires careful management of risks, including the possibility that the mean and standard deviation used are not stable over time or that the assumed mean reversion does not occur as expected due to changing market conditions.
